ViewPLUS SCADA Example Projects
Alarm Projects
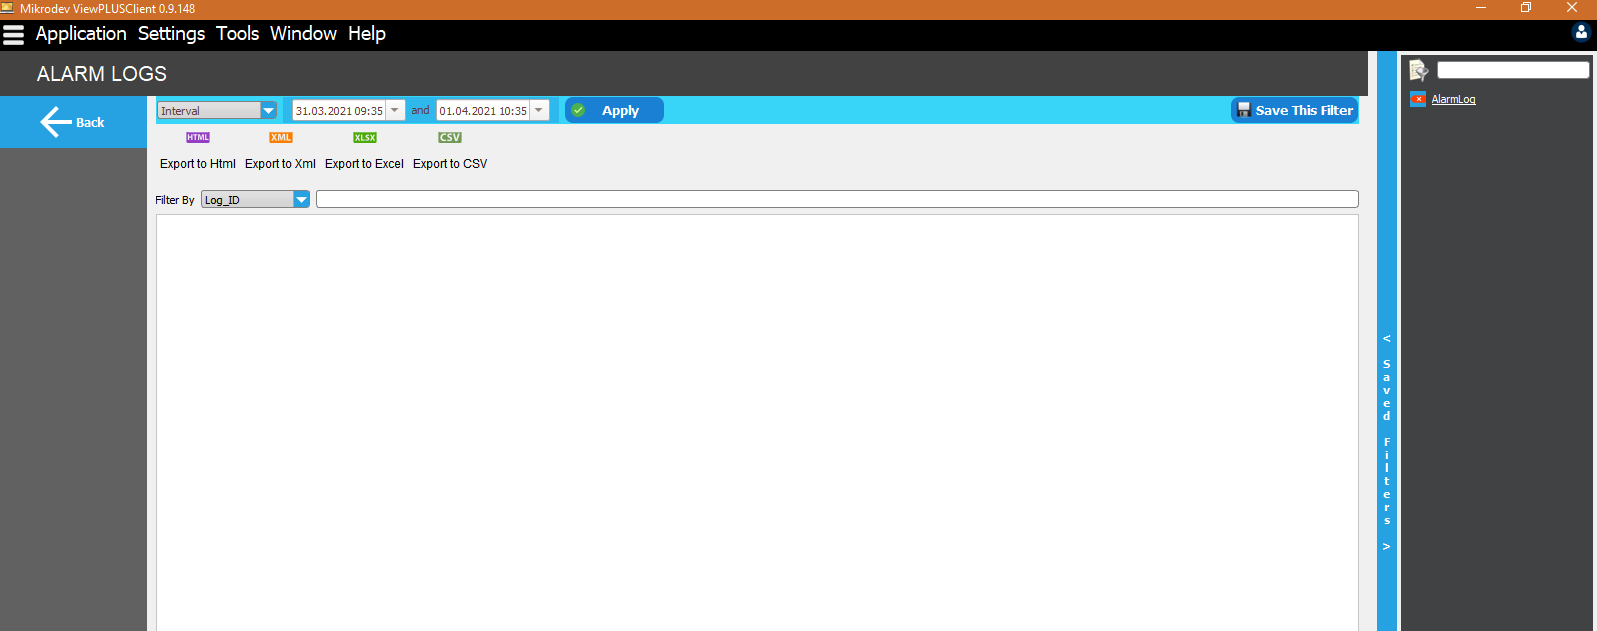
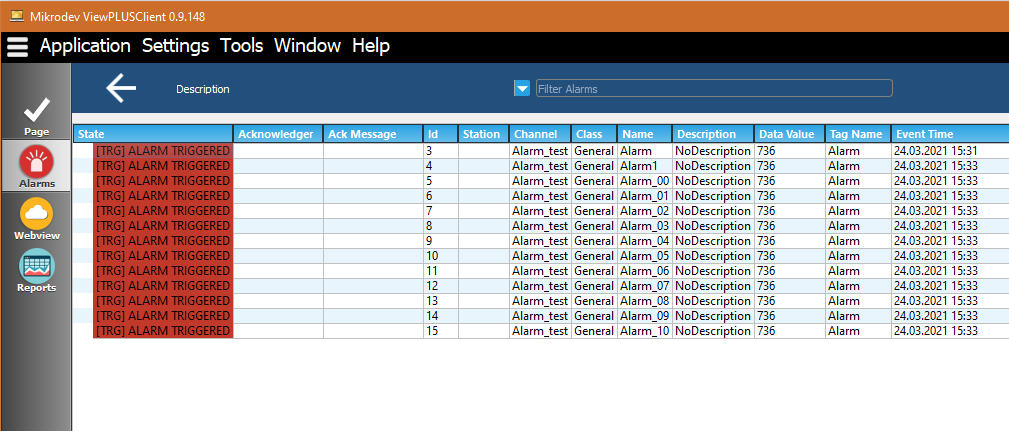
Applying Filter to Active Alarms and Records
By creating a filter, redirects to logs and active alarm page that can be made from within the pages.
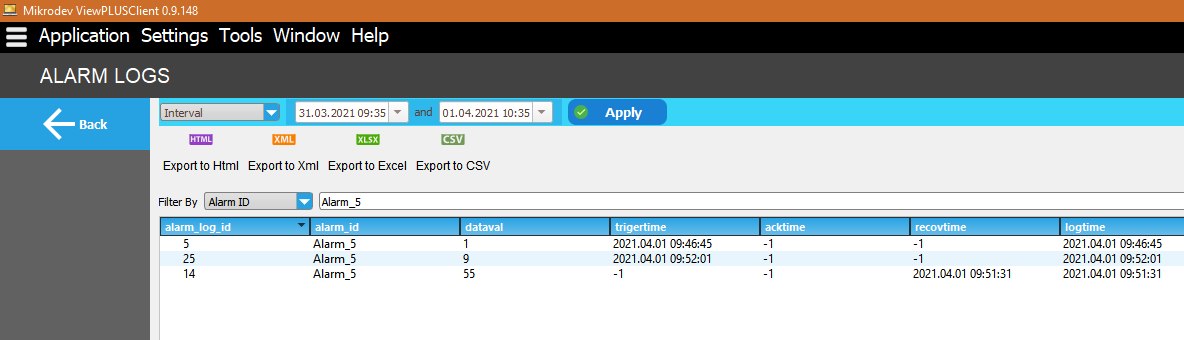
From the Scada reporter screen, requested alarm or tag records could be filtered by selecting. In the window that appears after the selection screen, the date duration is selected, and the filter is added by clicking on “Save This Filter”. The added filters appear in "Saved Filters" on the right side of the page.
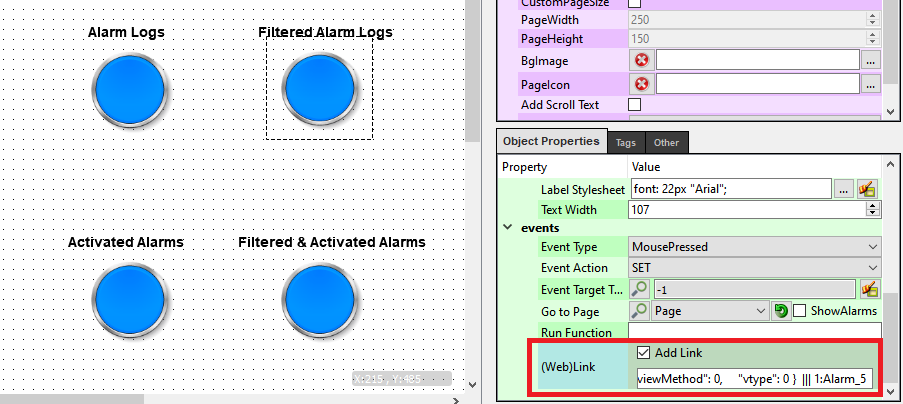
By right click on the saved filter and the link information is received. The received link information is added as a (Web) Link on the component.
{
    "alarmfilter": {
        "alarmclass": "",
        "itemIdList": [
            7,
            6,
            5,
            4,
            3,
            2,
            11,
            10,
            1,
            8,
            9
        ]
    },
    "contentType": 1,
    "datarange": {
        "ftip": 0,
        "higherBound": 0,
        "limitVal": 0,
        "lowerBound": 0
    },
    "limitRowCount": 500,
    "queryname": "AlarmLog",
    "reptypedef": {
        "periodTip": 0,
        "repTip": 0,
        "targetDatetime": "0",
        "timeFactor": 0
    },
    "reservedVal": -1,
    "tagfilter": {
        "ftip": 1740730552,
        "itemIdList": [
        ],
        "keywords": "",
        "parentChannel": "",
        "parentStation": ""
    },
    "timeinterval": {
        "endTime": "1617262500000",
        "intervaltip": 2,
        "startTime": "1617172500000",
        "timePeriod": "0",
        "timeValue": "0"
    },
    "viewMethod": 0,
    "vtype": 0
}
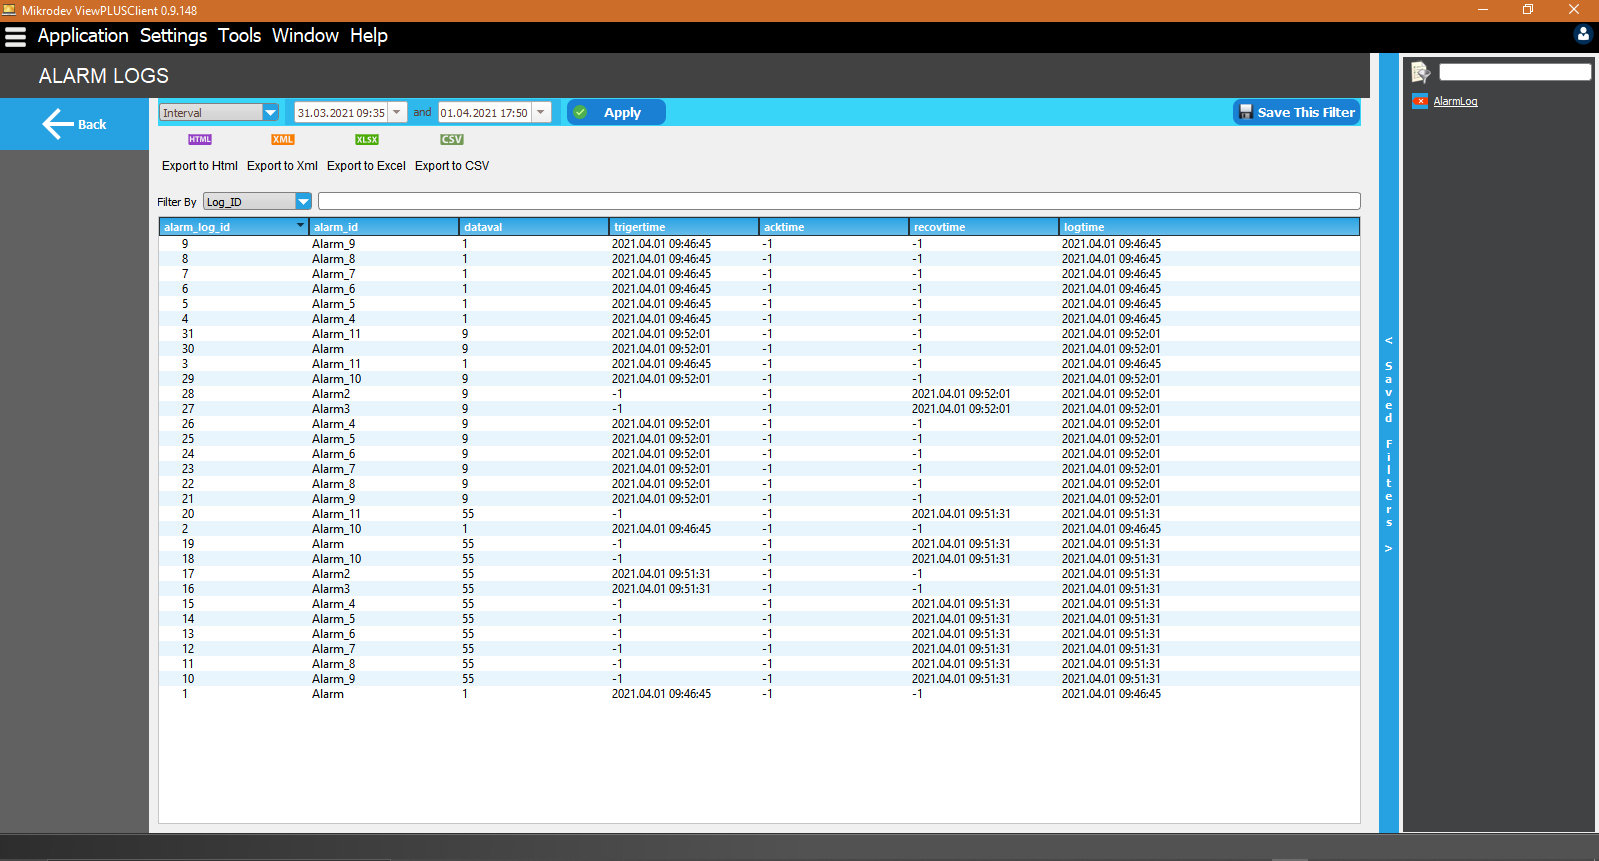
In order to redirect the alarm logs with filters, at the end of the link, “||| 1: AlarmName ”parameter expression is added. e.g for Alarm_5; “ ||| 1: Alarm_5 ”.
The expression with "1" indicates the "alarm_id" column on the "Scada Reporter" screen. Each column is expressed in numbers starting from 0 from left to right.
The expression specified with "alarm_5" filters according to the alarm ids under the "alarm_id" column.
{
    "alarmfilter": {
        "alarmclass": "",
        "itemIdList": [
            7,
            6,
            5,
            4,
            3,
            2,
            11,
            10,
            1,
            8,
            9
        ]
    },
    "contentType": 1,
    "datarange": {
        "ftip": 0,
        "higherBound": 0,
        "limitVal": 0,
        "lowerBound": 0
    },
    "limitRowCount": 500,
    "queryname": "AlarmLog",
    "reptypedef": {
        "periodTip": 0,
        "repTip": 0,
        "targetDatetime": "0",
        "timeFactor": 0
    },
    "reservedVal": -1,
    "tagfilter": {
        "ftip": 1740730552,
        "itemIdList": [
        ],
        "keywords": "",
        "parentChannel": "",
        "parentStation": ""
    },
    "timeinterval": {
        "endTime": "1617262500000",
        "intervaltip": 2,
        "startTime": "1617172500000",
        "timePeriod": "0",
        "timeValue": "0"
    },
    "viewMethod": 0,
    "vtype": 0
}
||| 1:Alarm_5
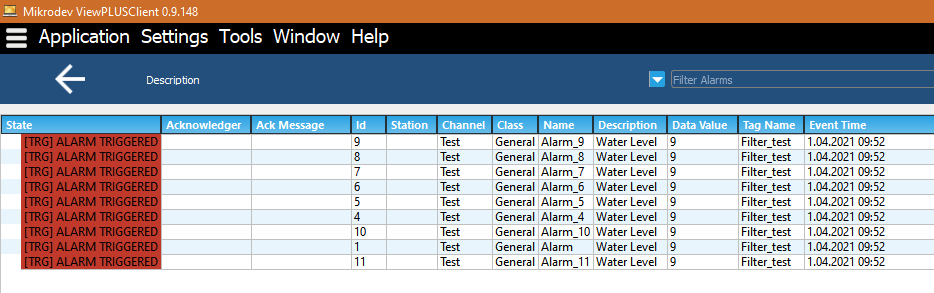
The expression indicated with “: Alarms” is used to redirect to active alarms page.
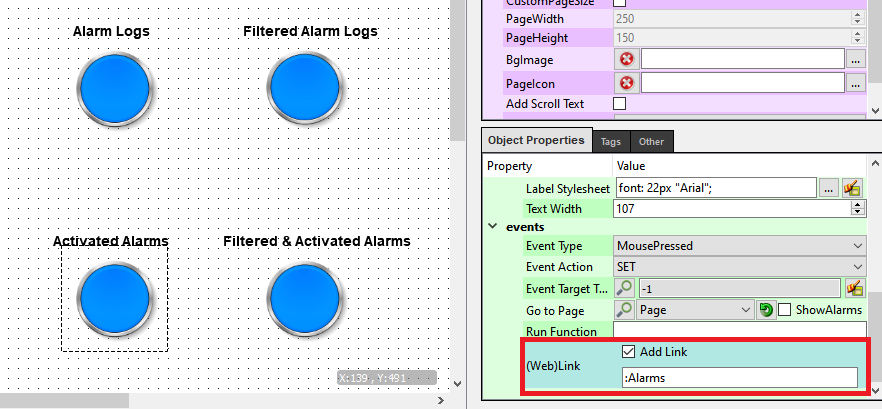
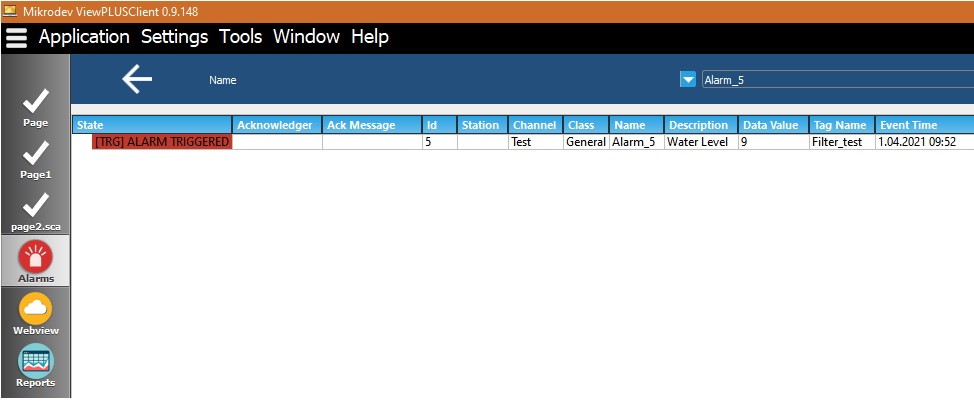
The expression ": Alarms ||| 7: Alarm_5" filters according to the seventh column and redirects it to the active alarm page.

Creating Constantly Increasing Counter Tag
In some cases, it may be desirable that the trend of the tag value read from the field is continuously increasing (such as reading a counter). In such cases, when the data read from the field is contaminated because of device replacement, project update, and etc.; trends and counter total values may also get contaminated. To prevent this, a mechanism on SCADA can be configured in the following way.
We need 3 seperate tags to solve the problem. As an example we will create a "CounterTag" tag. In parallel we will create a "CounterTag_latest" tag under "Database Channel" and a "CounterTag_controller" tag under Macro channel to fix field-based distortions so that this tag can read the latest value logged in the database.
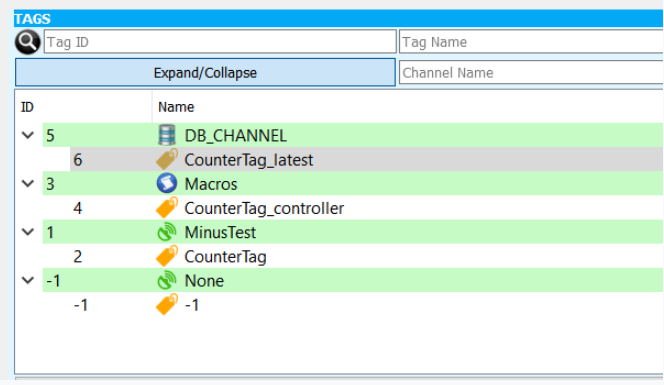
We will use the following query in the tag settings to get the most recent value we have logged into the "CounterTag_latest" tag:
select dataval from logs.lct_table where tag_id=2
This query will read the last logged value of the "CounterTag" tag with tag ID "2"
Finally, we will add the control macro to the "CounterTag_controller" tag. The macro will be:
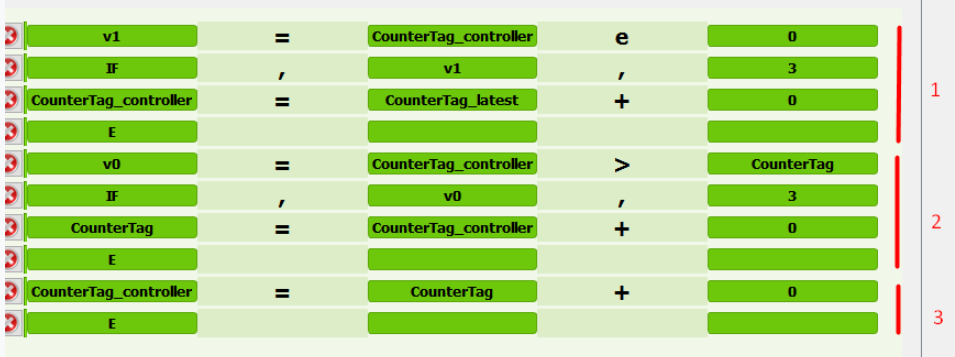
[v1=$4e0]
[IF,v1,3]
[$4=$6+0]
[E]
[v0=$4>$2]
[IF,v0,3]
[$2=$4+0]
[E]
[$4=$2+0]
[E]
This macro consists of 3 main sections:
Lines numbered as "1"; reads the last logged value from the database when the server is running for the first time.
Lines numbered as "2"; sets the value to be the value on the field device if it is less than the last log value for any reason.
Lines numbered as "3"; is the part where macro continuously updates the control tag.
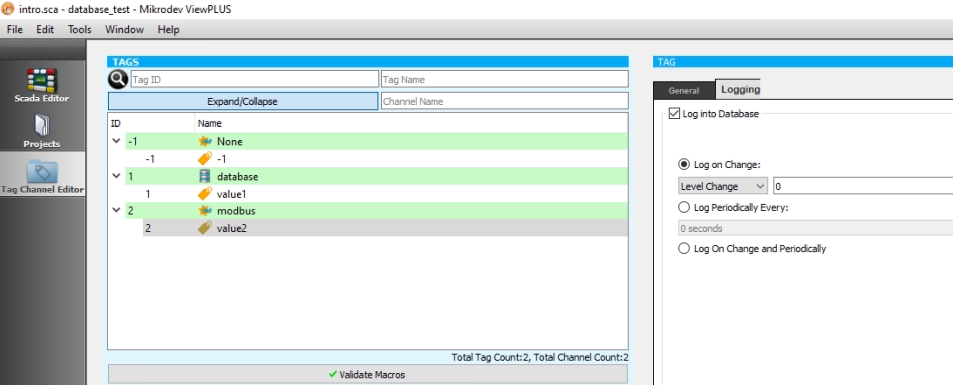
In order to prevent erroneous logs in addition to the structure created above, the "log only while increasing" option should be enabled in the tag logging settings.
User Manager Applications
User Authorization in Dynamic Pages
The "Run Function" parameter is defined in the relevant object for the dynamic page which is needed restricted access.
The "data1 = data2" information changes the tag names starting with data 1 in the directed page to the tag named data2. The information used after the semicolon indicates the access numbers for the page to be redirected.
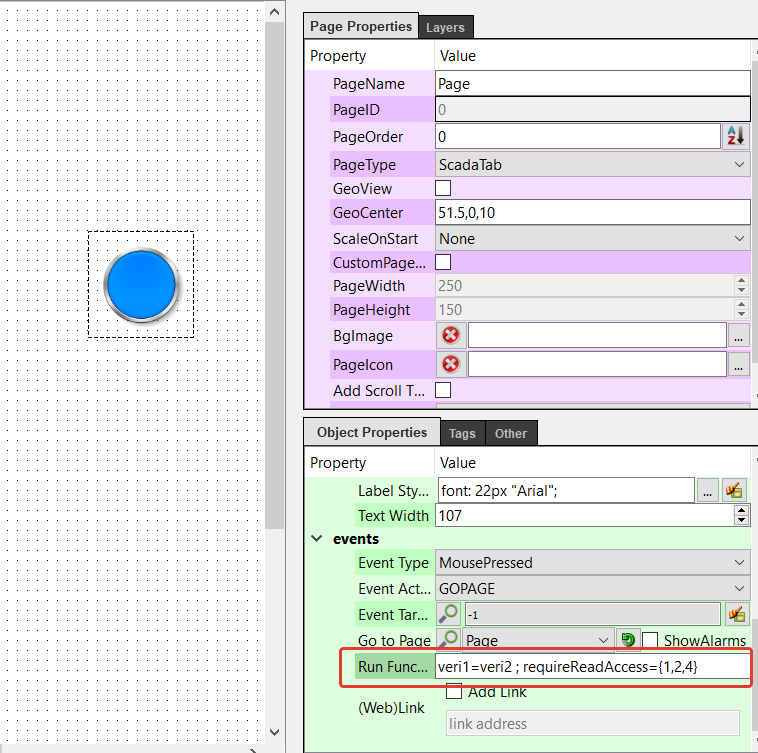
In order to access the page content specified with "requireReadAccess = {1,2,4}", these numbers must be marked under the User Access Rights. If these numbers are not checked in the User Access Rights window, they cannot access the relevant page.
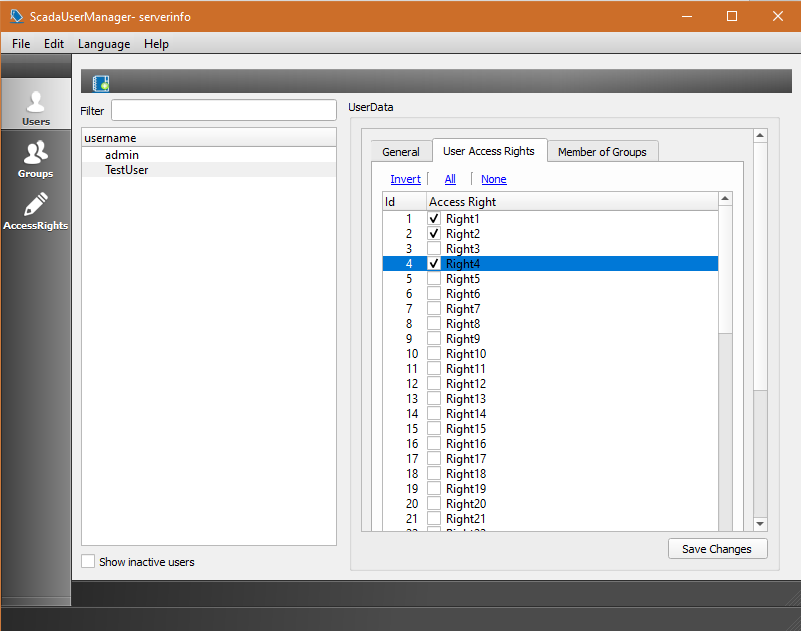
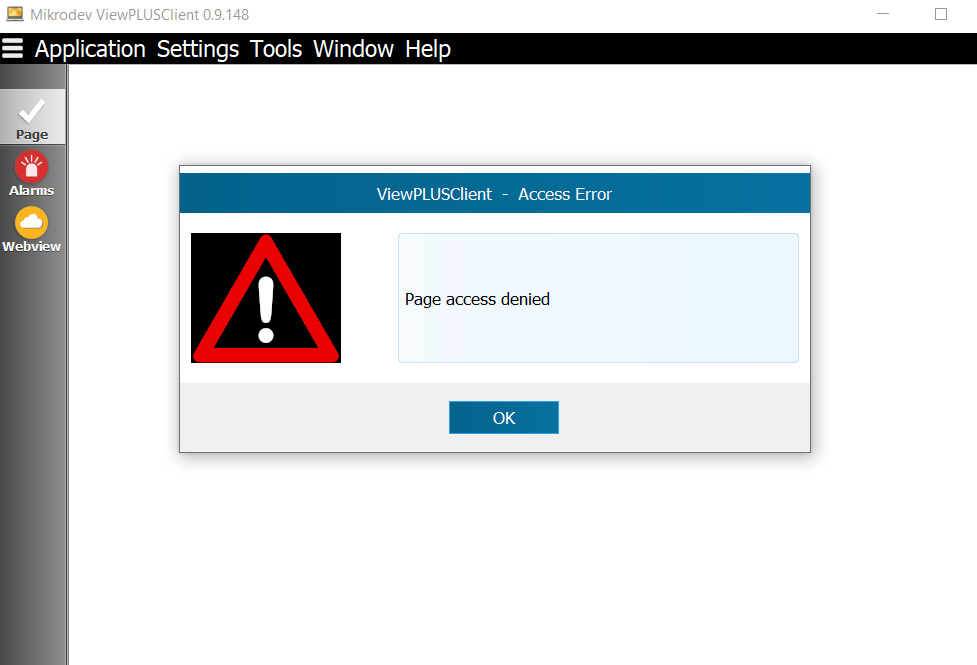
If the numbers in the "requireReadAccess" content are not selected in the user access right, the following warning screen is displayed when you want to be directed to the page.
ViewPLUS SCADA Protocol Applications
Channel: Database
Channel type used to make special queries from SCADA's own database.
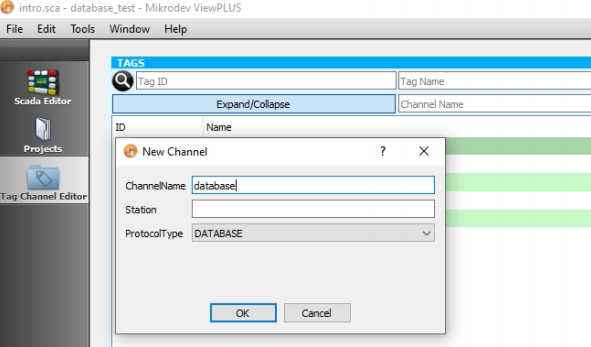
Create Channels And Tags
A channel is created by selecting the protocol type database in tag channel editor option.
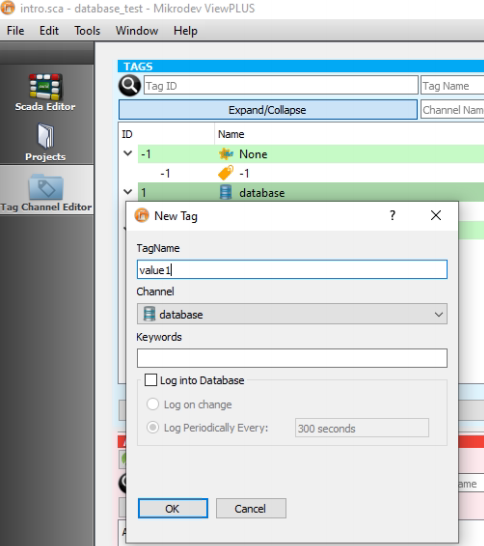
A label is created under the database channel.
Channel And Tag Configuration
Response Timeout: The time in milliseconds that represents the frequency with which the database query is executed. Queries are written in the «Query» option of the tag
A tag with tag ID 2 is attached to the database and transactions are performed over the database on this tag. Values from 1 to 100 are sent and the log is kept in the database.
Connection
With this query, it brings the last sent value from the database.
Channel: Global Database
It is the channel type used to create special queries by connecting to different databases and to transfer these query results to project tags.
PostgreSQL Database
Create Channels And Tags
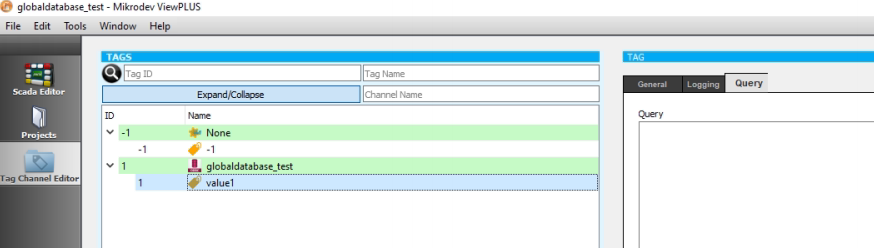
A channel is created by selecting the protocol type globaldatabase in tag channel editor option.
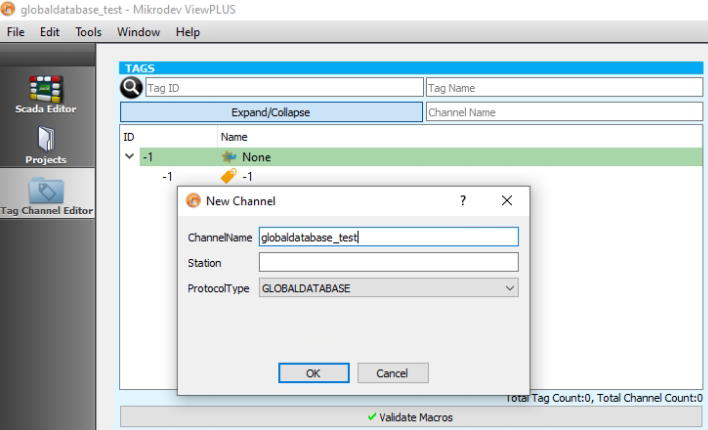
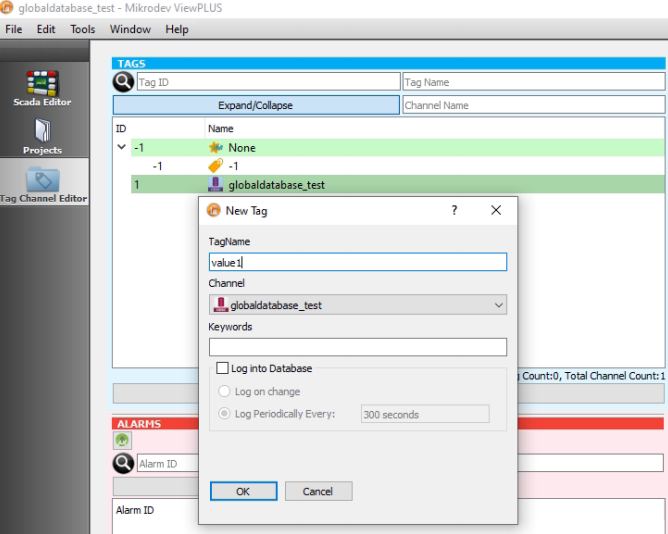
A label is created under the globaldatabase channel.
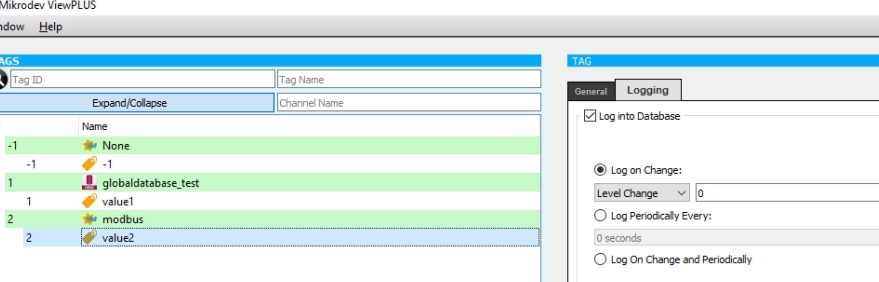
Channel And Tag Configuration
Information about PostgreSQL database type is entered on the channel screen. Response Timeout: The time in milliseconds that represents the frequency with which the database query is executed.
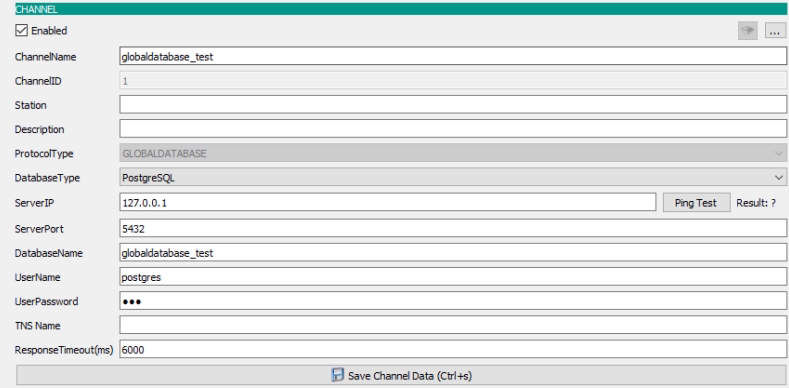
Queries are written in the «Query» option of the tag.
A tag with tag ID 2 is attached to the database and transactions are performed over the database on this tag. Values from 1 to 100 are sent and the log is kept in the database.
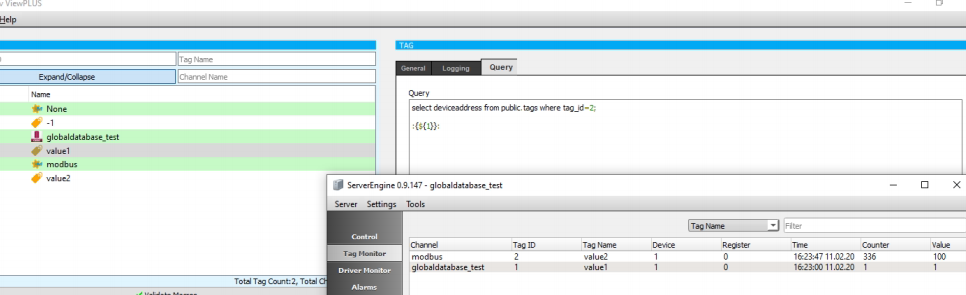
Connection
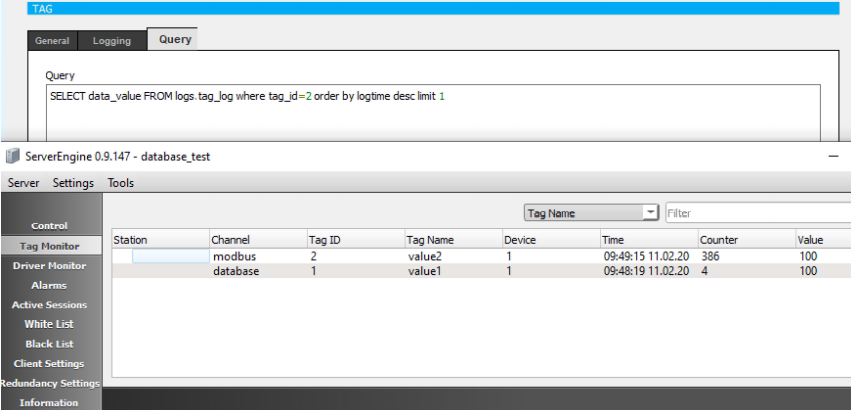
The device address information of the label number 2 was written in the query. Device address information is displayed on the server screen.
select deviceaddress from public.tags where tag_id=2;
:{${1}}:
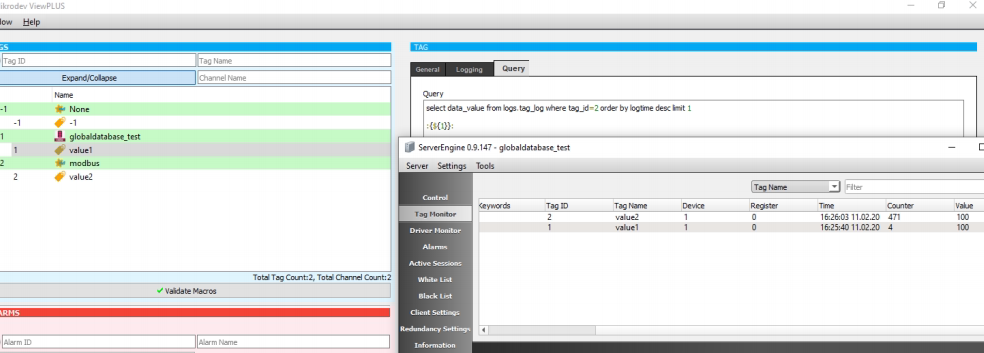
With this query, the last value sent from the database is set to the number 1 tag.
select data_value from logs.tag_log where tag_id=2 order by logtime desc limit 1
:{${1}}:
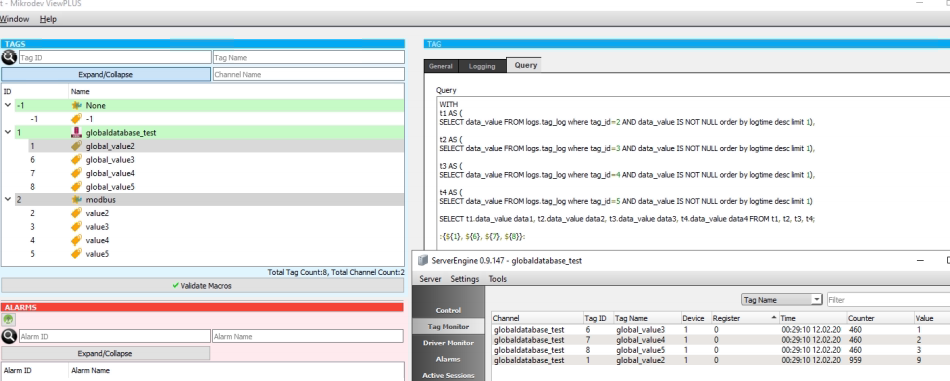
In the postgresql database query, the most recent values recorded in the database of the tags with id 2, 3, 4 and 5 were written in tags with ids 1, 6, 7, and 8, respectively.
 WITH
 t1 AS (
  SELECT  data_value from logs.tag_log where tag_id=2 AND data_value IS NOT NULL ORDER BY logtime DESC limit 1 ),
 t2 AS (
  SELECT  data_value from logs.tag_log where tag_id=3 AND data_value IS NOT NULL ORDER BY logtime DESC limit 1),
 t3 AS (
  SELECT  data_value from logs.tag_log where tag_id=4 AND data_value IS NOT NULL ORDER BY logtime DESC limit 1),
 t4 AS (
  SELECT  data_value from logs.tag_log where tag_id=5 AND data_value IS NOT NULL ORDER BY logtime DESC limit 1)

 SELECT t1.data_value data1, t2.data_value  data2, t3.data_value  data3, t4.data_value  data4
 FROM t1, t2 ,t3,t4;

 :{${1}, ${6} , ${7}, ${8}}:
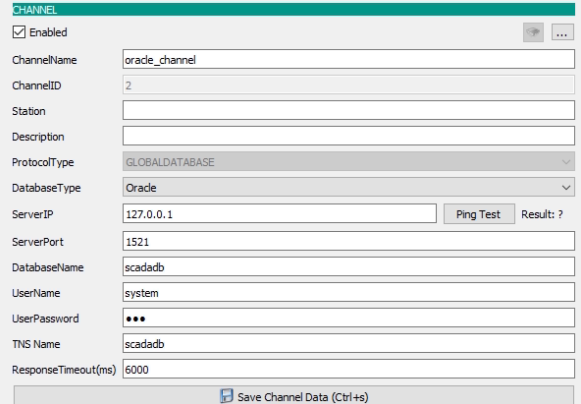
Oracle Database
This channel is used to connect to the oracle database and pull the desired data.
Channel And Tag Configuration
Information about Oracle database type is entered on the channel screen. The database information of the project is entered on the configuration screen.
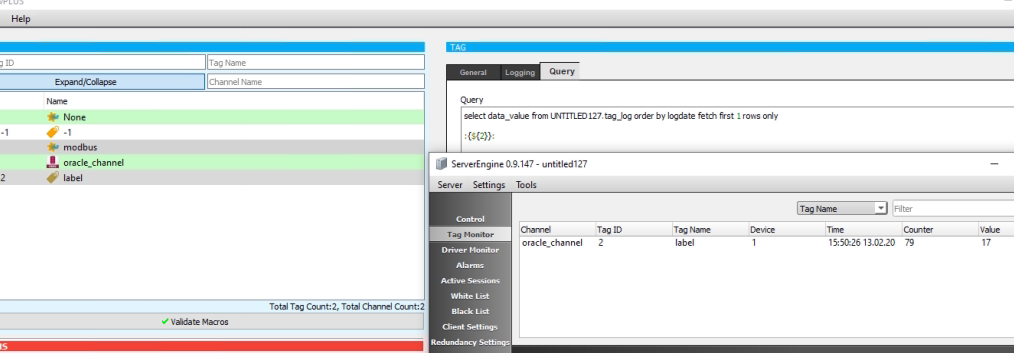
Connection
The first data recorded in the oracle database was captured by query. The data in the Oracle database is printed on the label with ID 2.
select data_value UNTITLED127.tag_log order by logdate fetch first 1 rows only
:{${2}}:
The last data recorded in the oracle database was captured by query.
select data_value UNTITLED127.tag_log order by logdate desc fetch first 1 rows only
:{${2}}:
Channel: JavaScript
JavaScript functions could be defined JavaScript channel. You can call various Math functions in your script. You can also use the values of system tags in the form of "${123}". You need to "return" a numeric value for the function result to be written on the "JavaScript Tag". *Channel Parameters
- Frame Timeout = The number of milliseconds that represents the frequency at which the JavaScript function is called. *Tag Parameters
- Query = The JavaScript expression to be called.
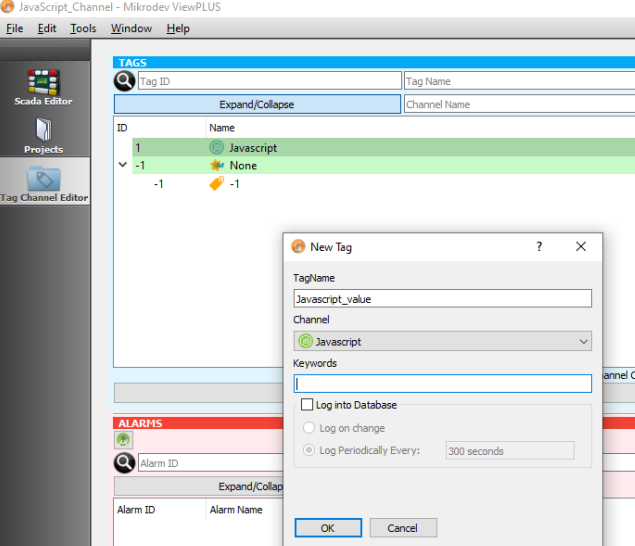
Create Channels And Tags
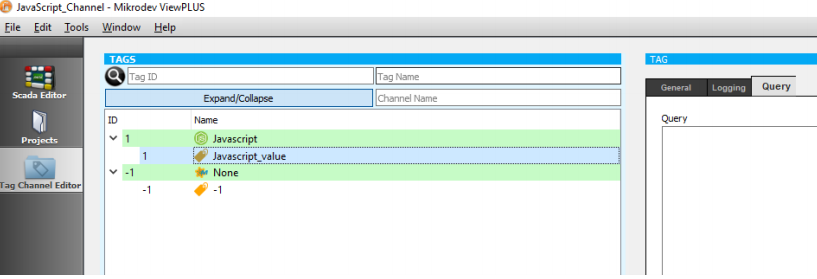
A channel is created by selecting the protocol type javascript in tag channel editor option.
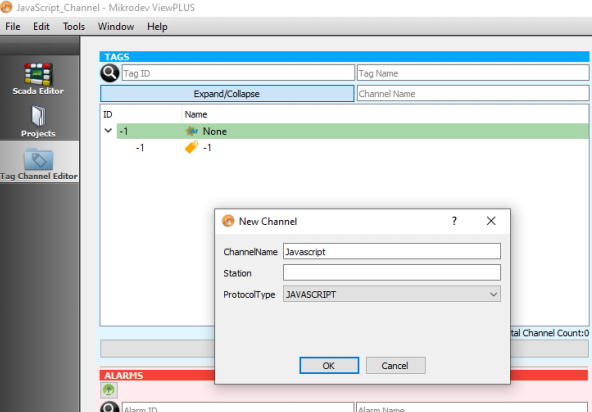
A label is created under the database channel.
Channel And Tag Configuration
Queries are written in the «Query» option of the tag.
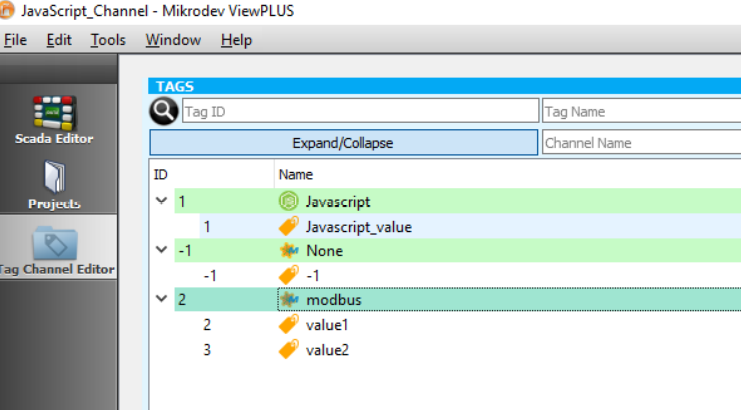
Sample javascript codes were written by choosing 2 different tags from the modbus channel.
Connection
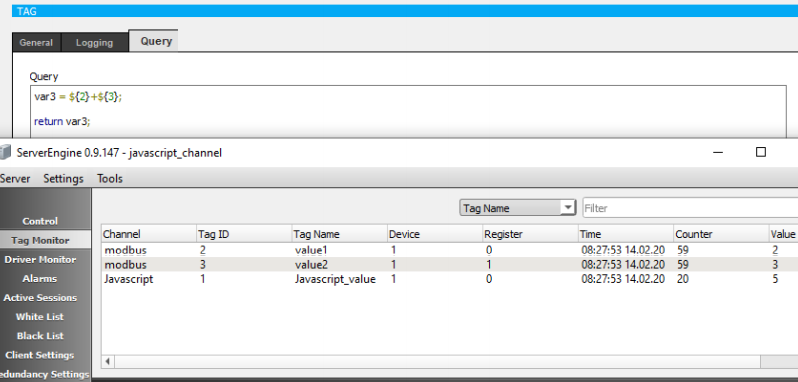
Example 1: The sum of the two labels is shown.
var3 = ${2}+${3};
return var3;
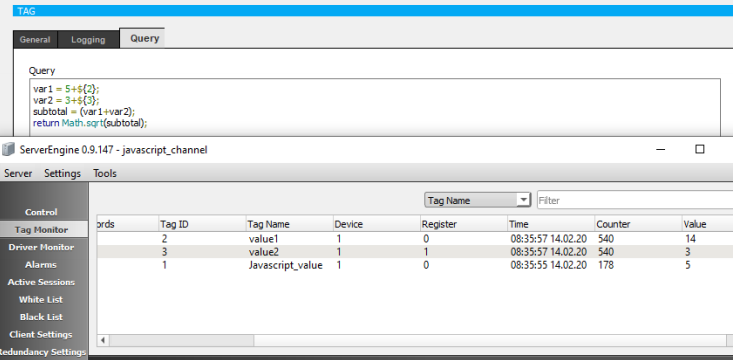
Example 2: In the first line : define a variable "var1" and assign "the value of tag with id 2" plus "5" In the second line : define a variable "var2" and assign "the value of tag with id 3" plus "3" In the third line : define a variable "subtotal" and assign "the sum of var1 and var2" to it In the last line : evaluate the square root of subtotal and return to that value. The return value will also be written as the value of the current JavaScript Tag.
var1 = 5+${2};
var2 = 3+${3};
subtotal=(var1+var2);
return Math.sqrt(subtotal);
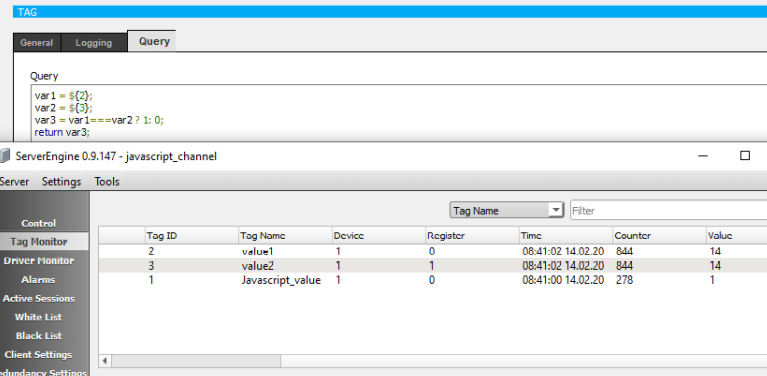
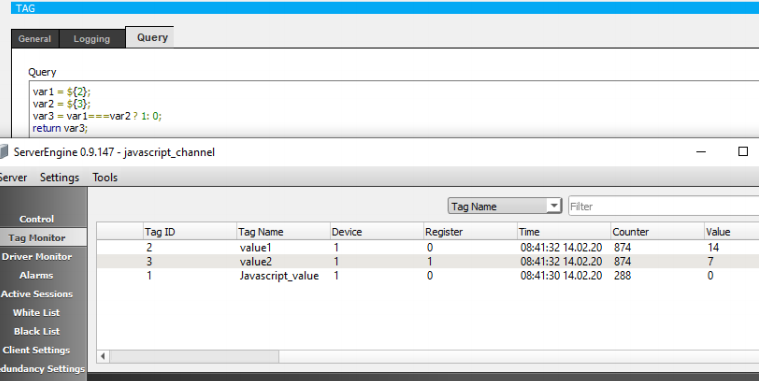
Important Note = You cannot set the values of other system tags in JavaScript tag. You need to use Macros to achieve this. Thus the following script will not work: ${3}= 3 + var1; Example 3: Tag values are assigned to variables. Return 1 if the variables are equal.Return 0 if variables are not equal.
var1 = ${2};
var2 = ${3};
var3 = var1===var2 ? 1:0;
return var3;
Channel: Server Info
By using this channel, you can get real-time information such as the num-ber of active alarms, system time, etc.
Here is a sample "JavaScript" statement to get system information:
var1 = :ALARMCOUNT(Panel1);
var2 = :ALARMCOUNT(Panel2);
totalalarms_defined= (var1 +var2 );
return totalalarms_defined; // It will return the total number of alarms defined for the "Panel1" and "Panel2" alarm classes.
The following keywords are supported in JavaScript.
:ALARMCOUNT()
returns the number of alarms defined in the system.
:ALARMCOUNT(ClassName)
returns the alarm number for the "ClassName" alarm class.
:ACTALARMCOUNT()
returns the number of active alarms defined in the system.
:ACTALARMCOUNT(ClassName)
returns the number of active alarms for the "ClassName" alarm class.
:ACKEDALARMCOUNT()
returns the number of confirmed active alarms defined in the system.
:ACKEDALARMCOUNT(ClassName)
returns the number of confirmed active alarms for the "ClassName" alarm class.
:SYSTEMTIME()
returns the system time of the SCADA server in milliseconds since epoch.
:CONNECTEDCHANNELS(ChannelName)
returns the number of channels with an active connection and a name containing the keyword "ChannelName".
:UNCONNECTEDCHANNELS(ChannelName)
returns the number of channels that are not connected and have a name containing the keyword "ChannelName"
The channel is created by selecting the protocol type "SERVERINFO" in the Tag Channel Editor.
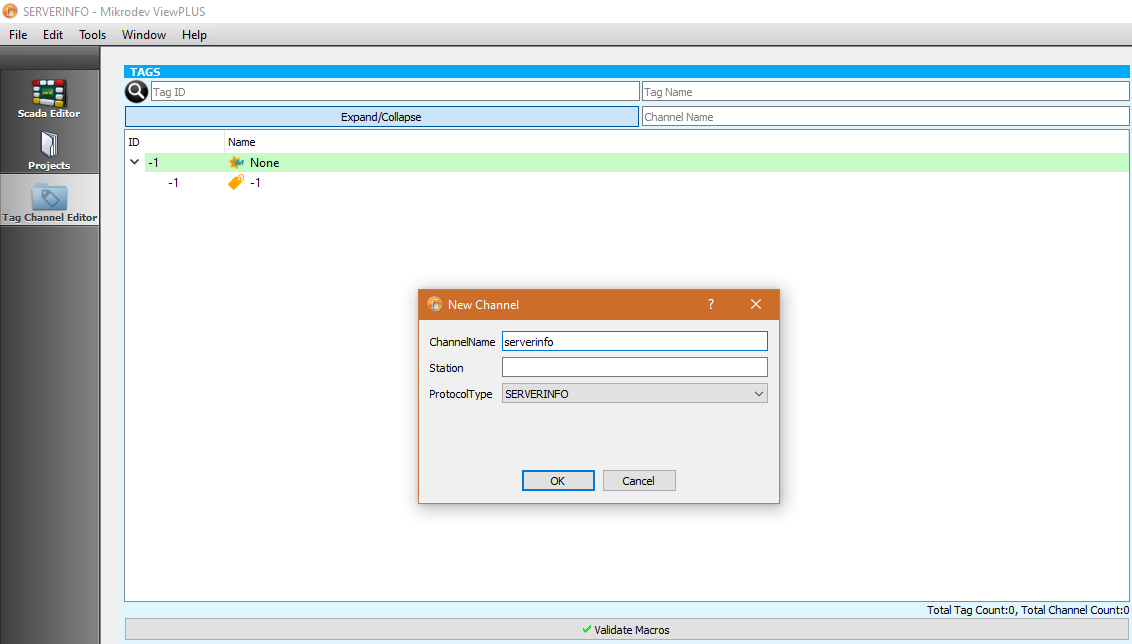
By writing queries within the labels created under the "SERVERINFO" channel, information related to channels and alarms can be obtained. According to the query defined below, the total number of active alarms in the project can be read on the tag.
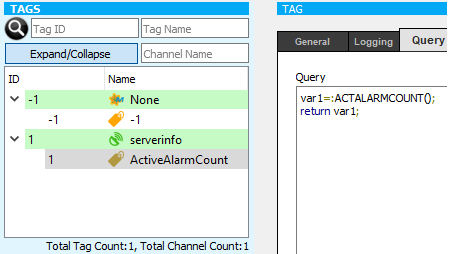
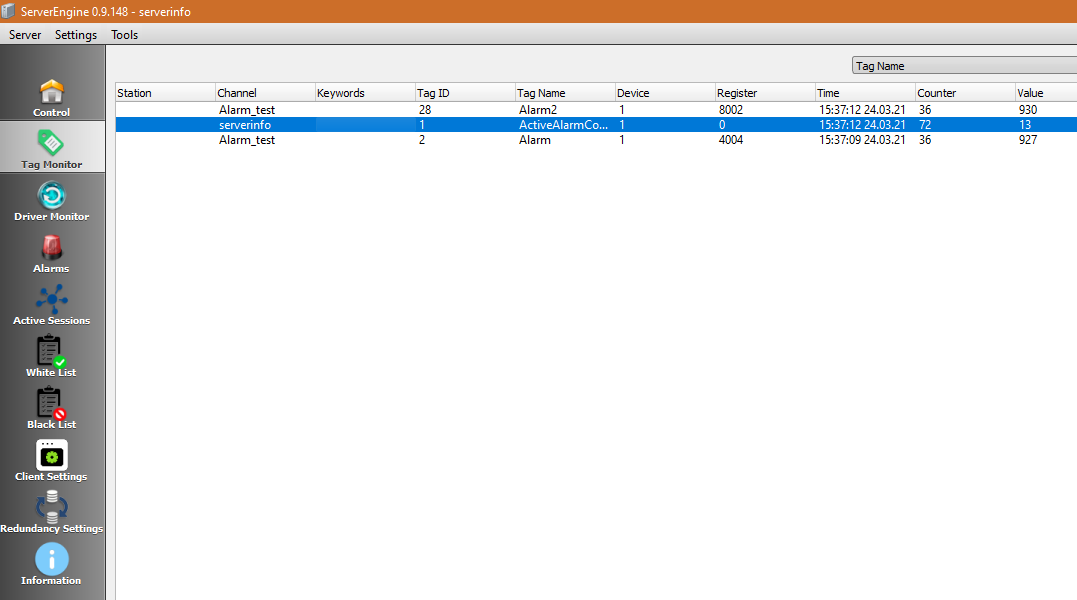
The total number of active alarms is displayed on the label under the de-fined “SERVERINFO” channel.
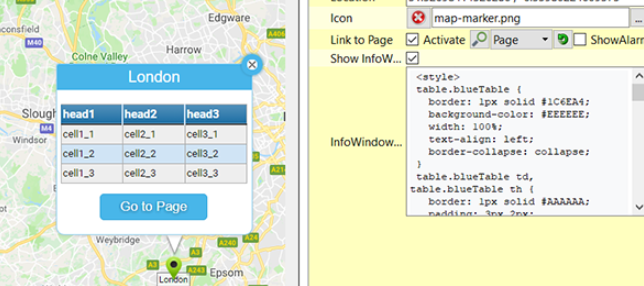
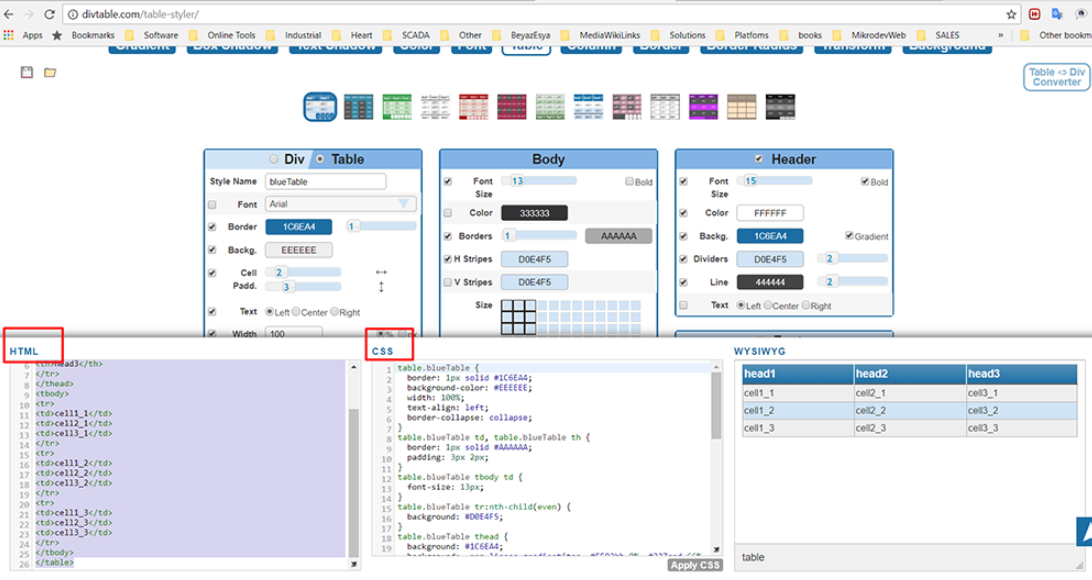
Designing Fancy Tables For Map Views
You can use some third party applications for designing tables to be used to display data in your Map Views. One of these services could be found on this link
By using this service you can stylise you table and auto generate a CSS and HTML code.
To be able to use the generated code on Map View, you need to put both these code into InfoWindowContent. But before pasting the code into InfoWindowContent; you need to put the CSS code into "
tags.The structure of the code should be as following:
<style> ...CSS Code Here...</style>
        ... HTML Code Here ...
For example if your generated CSS code is like :
table.blueTable {
  border: 1px solid #1C6EA4;
  background-color: #EEEEEE;
  width: 100%;
  text-align: left;
  border-collapse: collapse;
}
table.blueTable td, table.blueTable th {
  border: 1px solid #AAAAAA;
  padding: 3px 2px;
}
table.blueTable tbody td {
  font-size: 13px;
}
table.blueTable tr:nth-child(even) {
  background: #D0E4F5;
}
table.blueTable thead {
  background: #1C6EA4;
  background: -moz-linear-gradient(top, #5592bb 0%, #327cad 66%, #1C6EA4 100%);
  background: -webkit-linear-gradient(top, #5592bb 0%, #327cad 66%, #1C6EA4 100%);
  background: linear-gradient(to bottom, #5592bb 0%, #327cad 66%, #1C6EA4 100%);
  border-bottom: 2px solid #444444;
}
table.blueTable thead th {
  font-size: 15px;
  font-weight: bold;
  color: #FFFFFF;
  border-left: 2px solid #D0E4F5;
}
table.blueTable thead th:first-child {
  border-left: none;
}

table.blueTable tfoot {
  font-size: 14px;
  font-weight: bold;
  color: #FFFFFF;
  background: #D0E4F5;
  background: -moz-linear-gradient(top, #dcebf7 0%, #d4e6f6 66%, #D0E4F5 100%);
  background: -webkit-linear-gradient(top, #dcebf7 0%, #d4e6f6 66%, #D0E4F5 100%);
  background: linear-gradient(to bottom, #dcebf7 0%, #d4e6f6 66%, #D0E4F5 100%);
  border-top: 2px solid #444444;
}
table.blueTable tfoot td {
  font-size: 14px;
}
table.blueTable tfoot .links {
  text-align: right;
}
table.blueTable tfoot .links a{
  display: inline-block;
  background: #1C6EA4;
  color: #FFFFFF;
  padding: 2px 8px;
  border-radius: 5px;
}
And your table HTML is like:
<table class="blueTable">
 <thead>
 <tr>
 <th>head1</th>
 <th>head2</th>
 <th>head3</th>
 </tr>
 </thead>
 <tbody>
 <tr>
 <td>cell1_1</td>
 <td>cell2_1</td>
 <td>cell3_1</td>
 </tr>
 <tr>
 <td>cell1_2</td>
 <td>cell2_2</td>
 <td>cell3_2</td>
 </tr>
 <tr>
 <td>cell1_3</td>
 <td>cell2_3</td>
 <td>cell3_3</td>
 </tr>
 </tbody>
 </table>
Then your resulting code to be pasted into the InfoWindofContent should be like:
<style>
 table.blueTable {
   border: 1px solid #1C6EA4;
   background-color: #EEEEEE;
   width: 100%;
   text-align: left;
   border-collapse: collapse;
 }
 table.blueTable td, table.blueTable th {
   border: 1px solid #AAAAAA;
   padding: 3px 2px;
 }
 table.blueTable tbody td {
   font-size: 13px;
 }
 table.blueTable tr:nth-child(even) {
   background: #D0E4F5;
 }
 table.blueTable thead {
   background: #1C6EA4;
   background: -moz-linear-gradient(top, #5592bb 0%, #327cad 66%, #1C6EA4 100%);
   background: -webkit-linear-gradient(top, #5592bb 0%, #327cad 66%, #1C6EA4 100%);
   background: linear-gradient(to bottom, #5592bb 0%, #327cad 66%, #1C6EA4 100%);
   border-bottom: 2px solid #444444;
 }
 table.blueTable thead th {
   font-size: 15px;
   font-weight: bold;
   color: #FFFFFF;
   border-left: 2px solid #D0E4F5;
 }
 table.blueTable thead th:first-child {
   border-left: none;
 }

 table.blueTable tfoot {
   font-size: 14px;
   font-weight: bold;
   color: #FFFFFF;
   background: #D0E4F5;
   background: -moz-linear-gradient(top, #dcebf7 0%, #d4e6f6 66%, #D0E4F5 100%);
   background: -webkit-linear-gradient(top, #dcebf7 0%, #d4e6f6 66%, #D0E4F5 100%);
   background: linear-gradient(to bottom, #dcebf7 0%, #d4e6f6 66%, #D0E4F5 100%);
   border-top: 2px solid #444444;
 }
 table.blueTable tfoot td {
   font-size: 14px;
 }
 table.blueTable tfoot .links {
   text-align: right;
 }
 table.blueTable tfoot .links a{
   display: inline-block;
   background: #1C6EA4;
   color: #FFFFFF;
   padding: 2px 8px;
   border-radius: 5px;
 }
 </style>

 <table class="blueTable">
 <thead>
 <tr>
 <th>head1</th>
 <th>head2</th>
 <th>head3</th>
 </tr>
 </thead>
 <tbody>
 <tr>
 <td>cell1_1</td>
 <td>cell2_1</td>
 <td>cell3_1</td>
 </tr>
 <tr>
 <td>cell1_2</td>
 <td>cell2_2</td>
 <td>cell3_2</td>
 </tr>
 <tr>
 <td>cell1_3</td>
 <td>cell2_3</td>
 <td>cell3_3</td>
 </tr>
 </tbody>
 </table>
On the Map View the table will look like: