ViewPLUS SCADA Reporting
SCADA Software provides a Reporter feature that allows you to view and analyze trend data recorded by the SCADA system. Reporting is performed on three primary types of records: tag logs, alarm logs, and event logs.
To access the Reporter screen, please follow the instructions below:
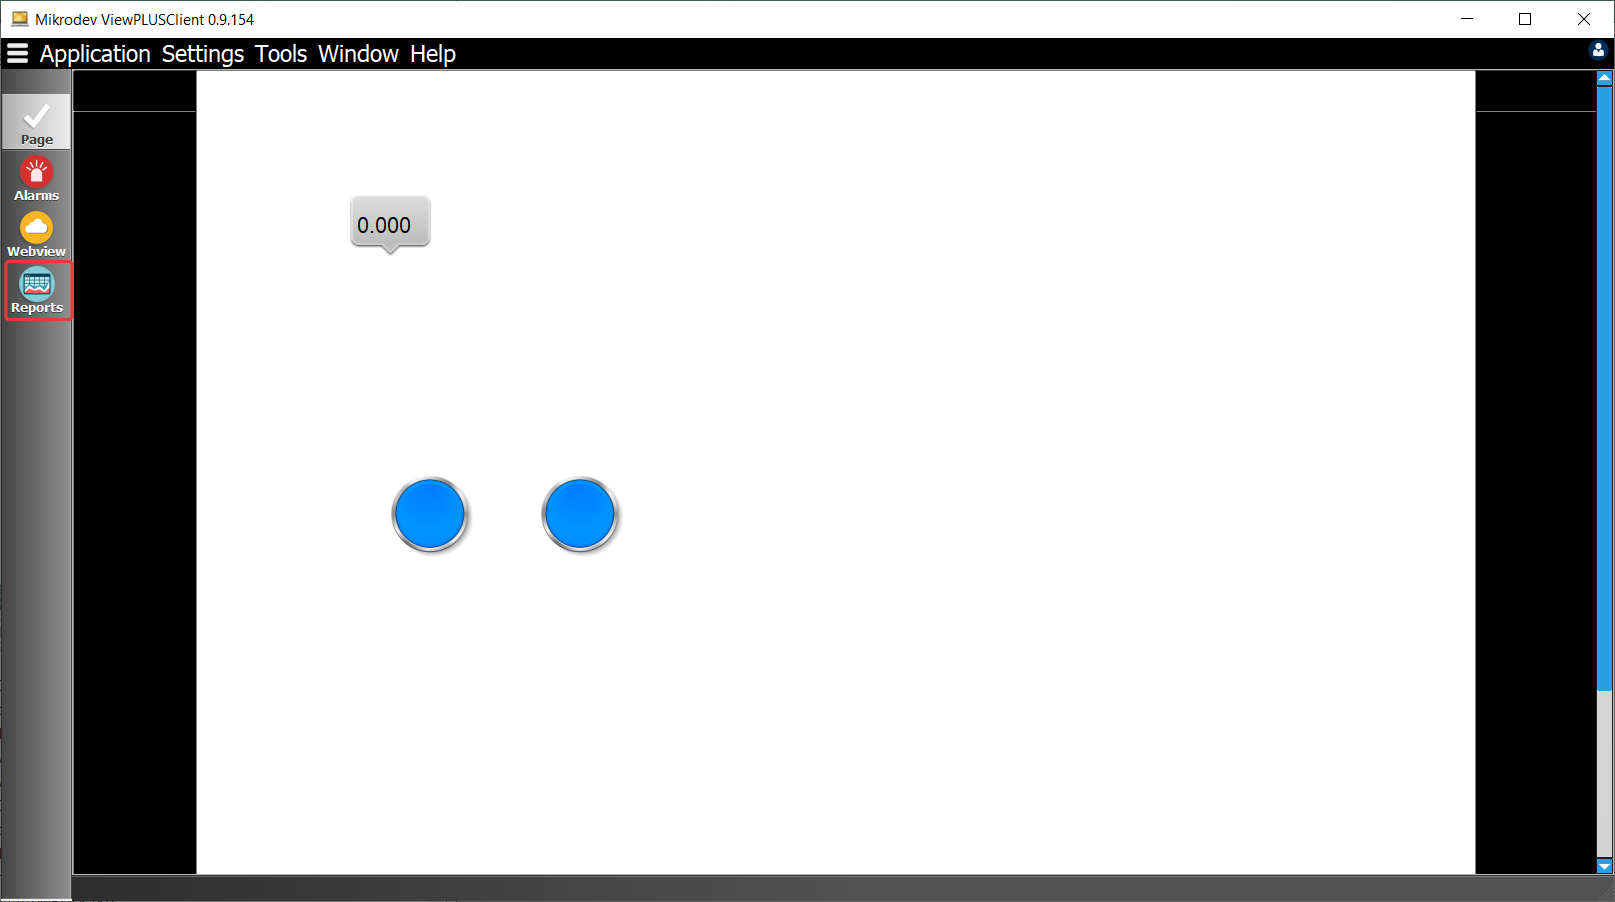
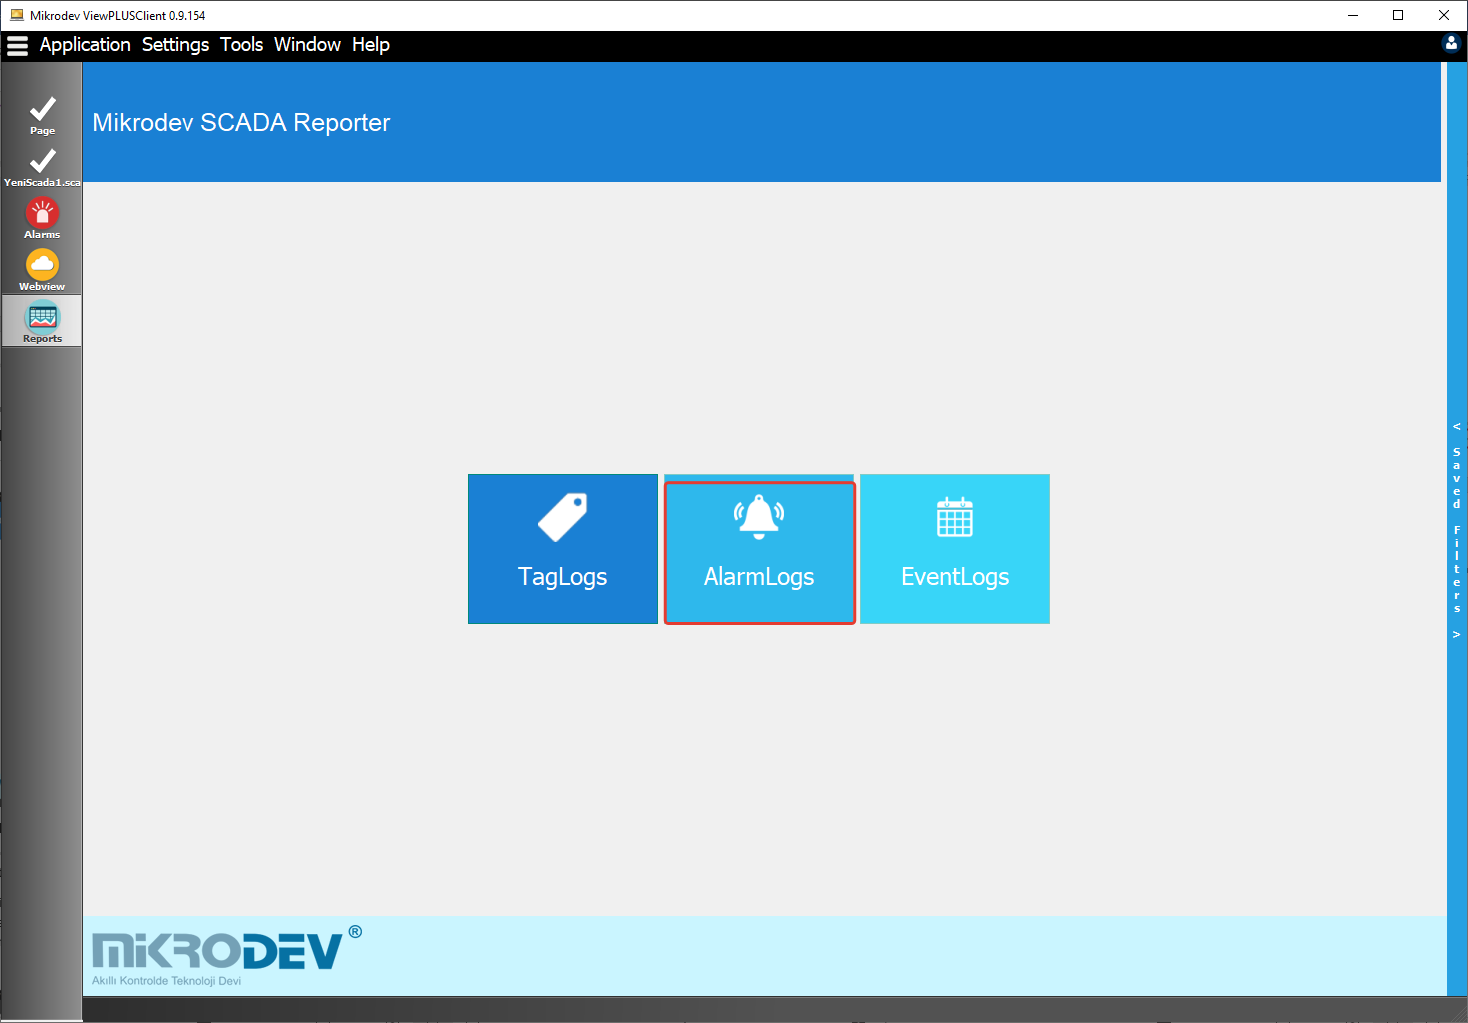
First, start the server in your project. -> Open the ViewPLUS Client application. -> Click on the Reports tab located in the left sidebar.
Note: If the Reports tab is not available in the left sidebar of the opened ViewPLUS Client screen, make sure that the user you logged in with has access rights to view reports.
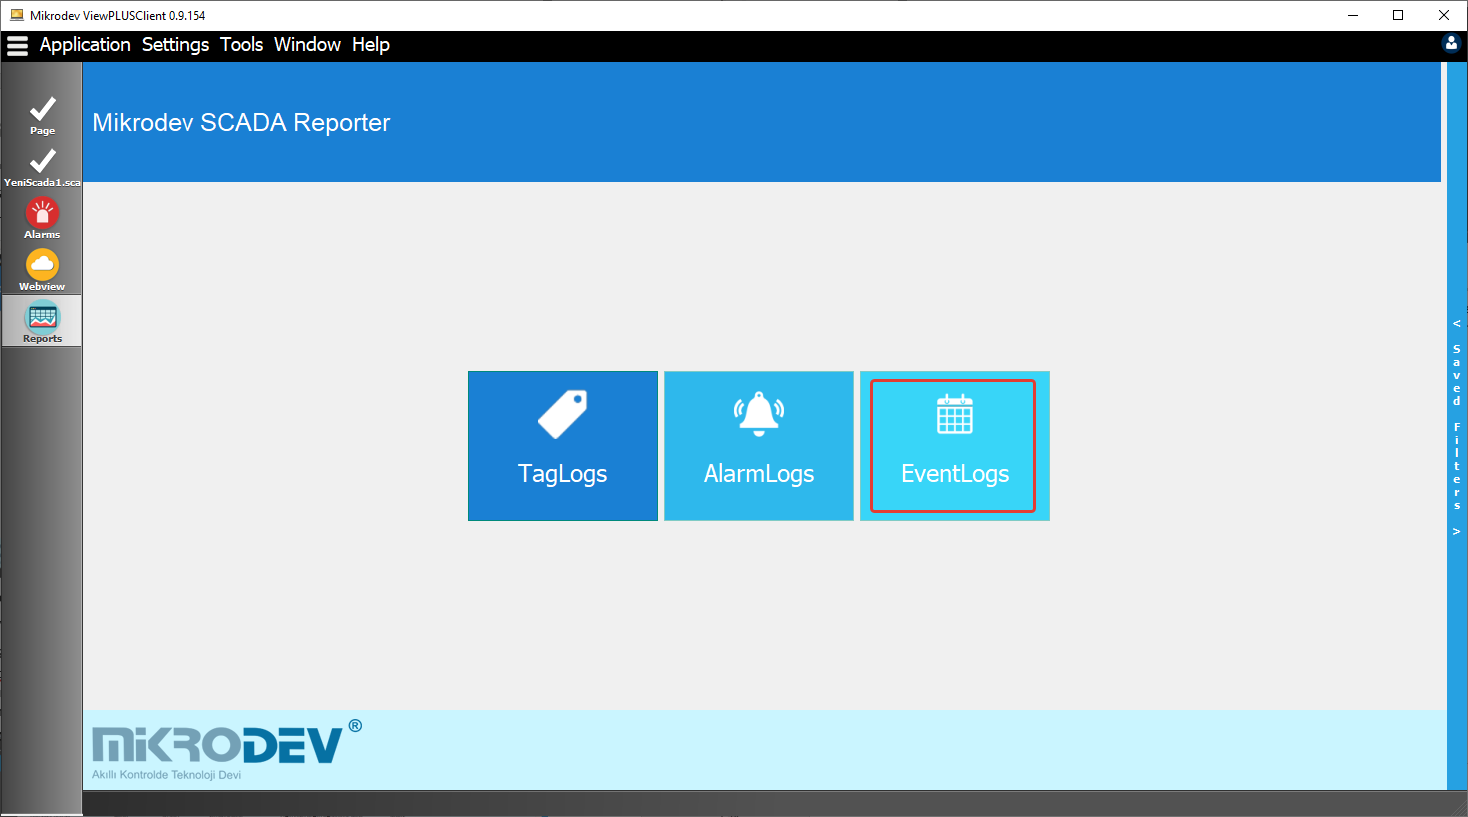
When you follow the above steps, you will have accessed the Mikrodev SCADA Reporter screen.
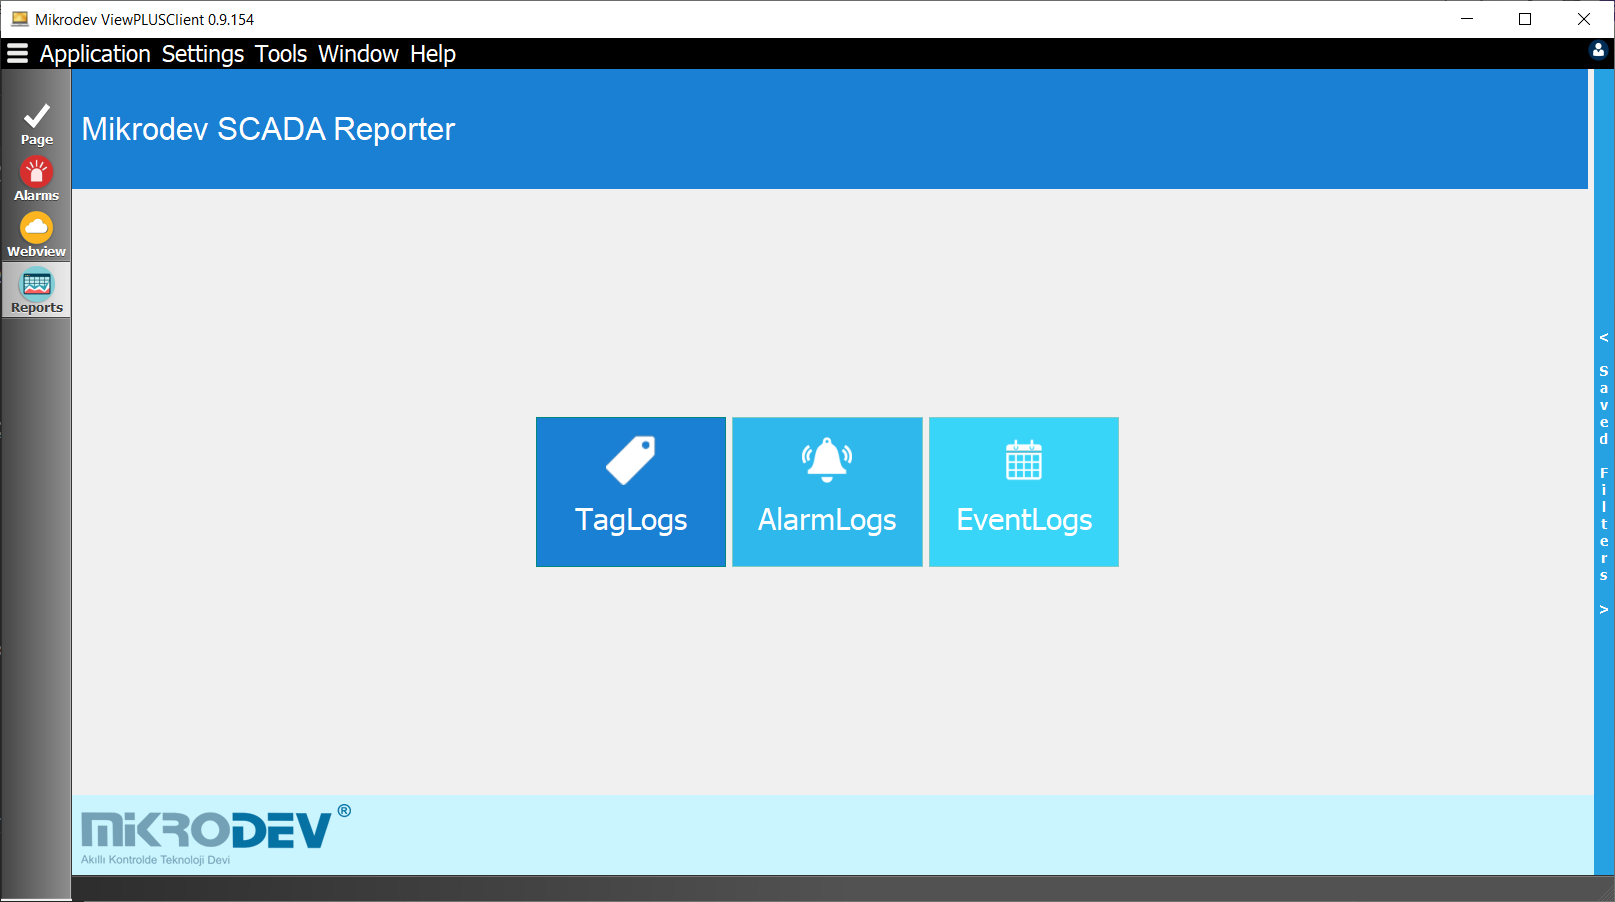
Tag Logs
Tag logs are the data recorded depending on the configuration of the Logging option in the ViewPLUS Tag Channel Editor page.
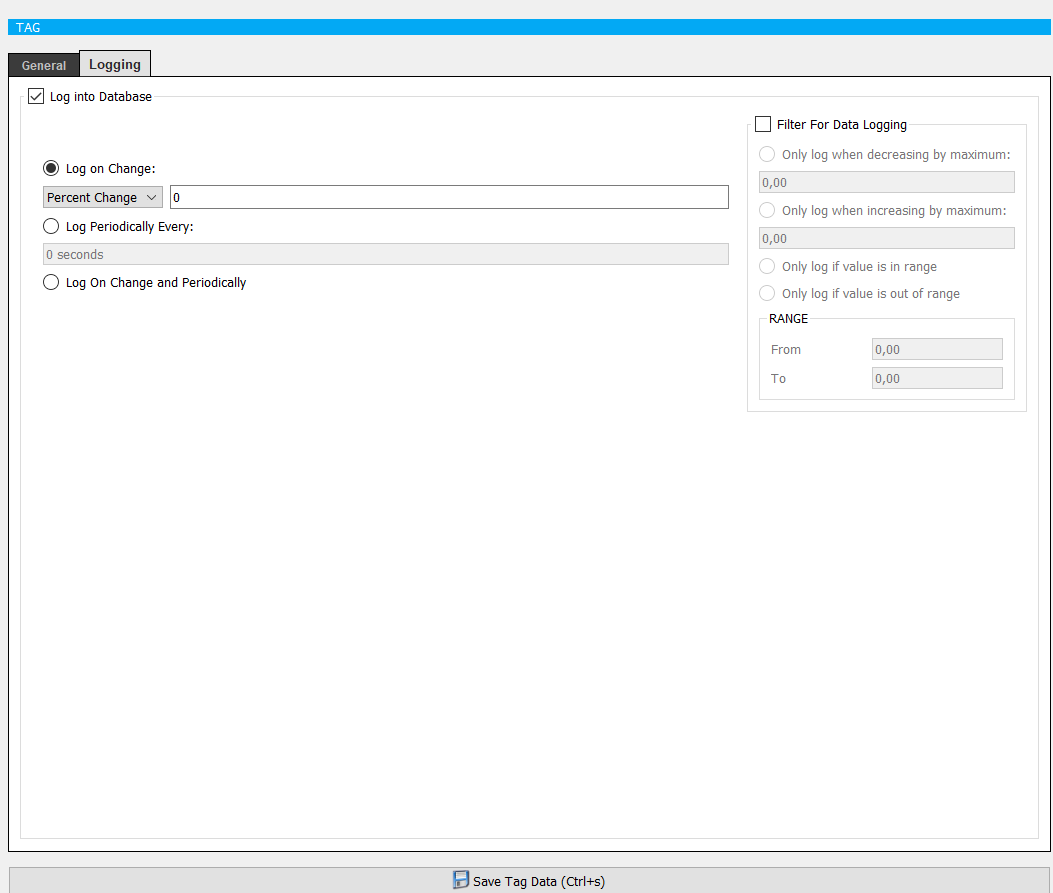
Filtering based on the tag's location, time, and other parameters allows the creation of output in various formats.
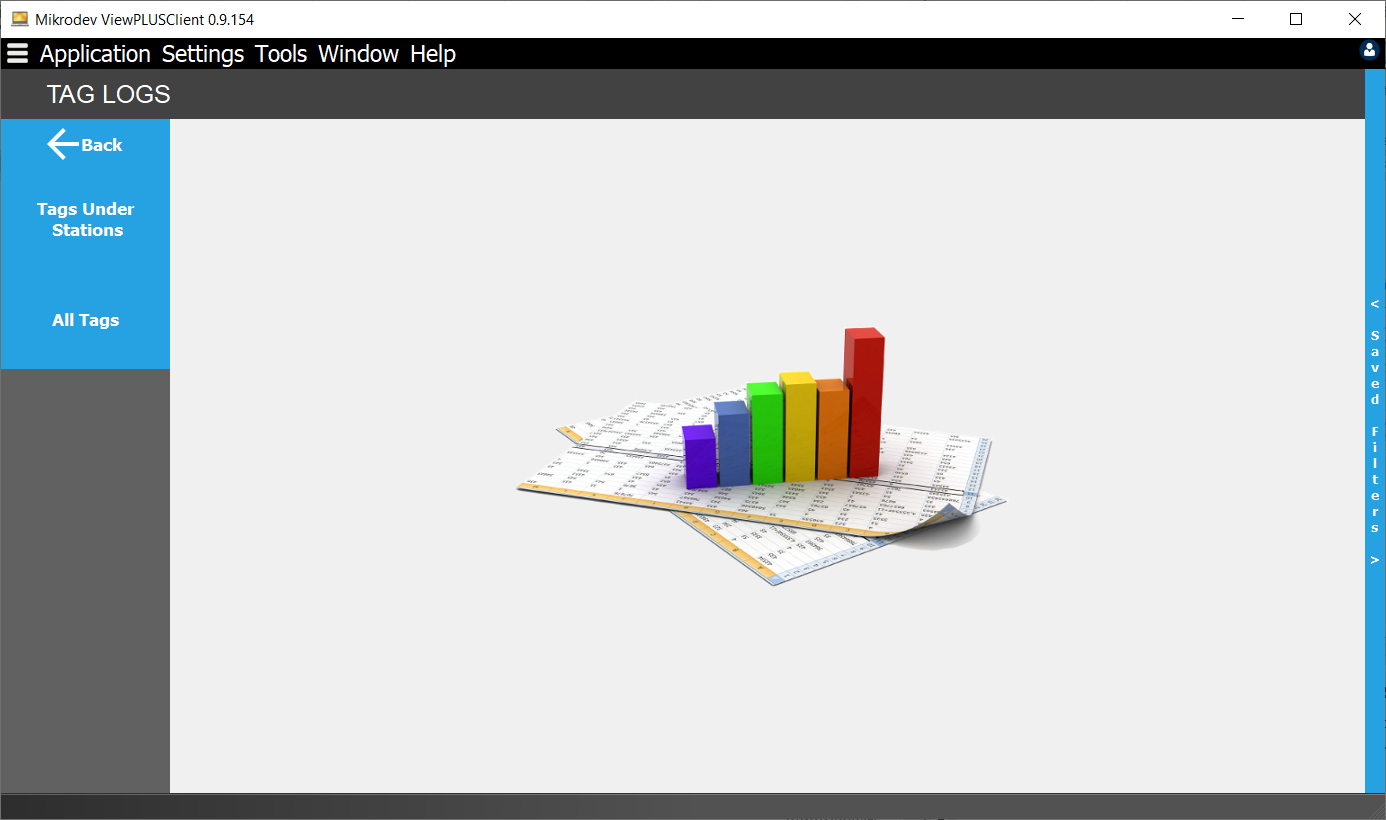
Tag Selection for Display on the Reporting Screen
In the tag selection screen, labels under a station can be grouped or all of them can be selected. If you choose the option of labels under the station, a list of all stations will be displayed.
Note: In ViewPLUS SCADA Reporter -> Tag Logs -> Tag Selection window, only the tags with logging enabled are displayed.
When clicked on the station name, the tags under the station can be listed.
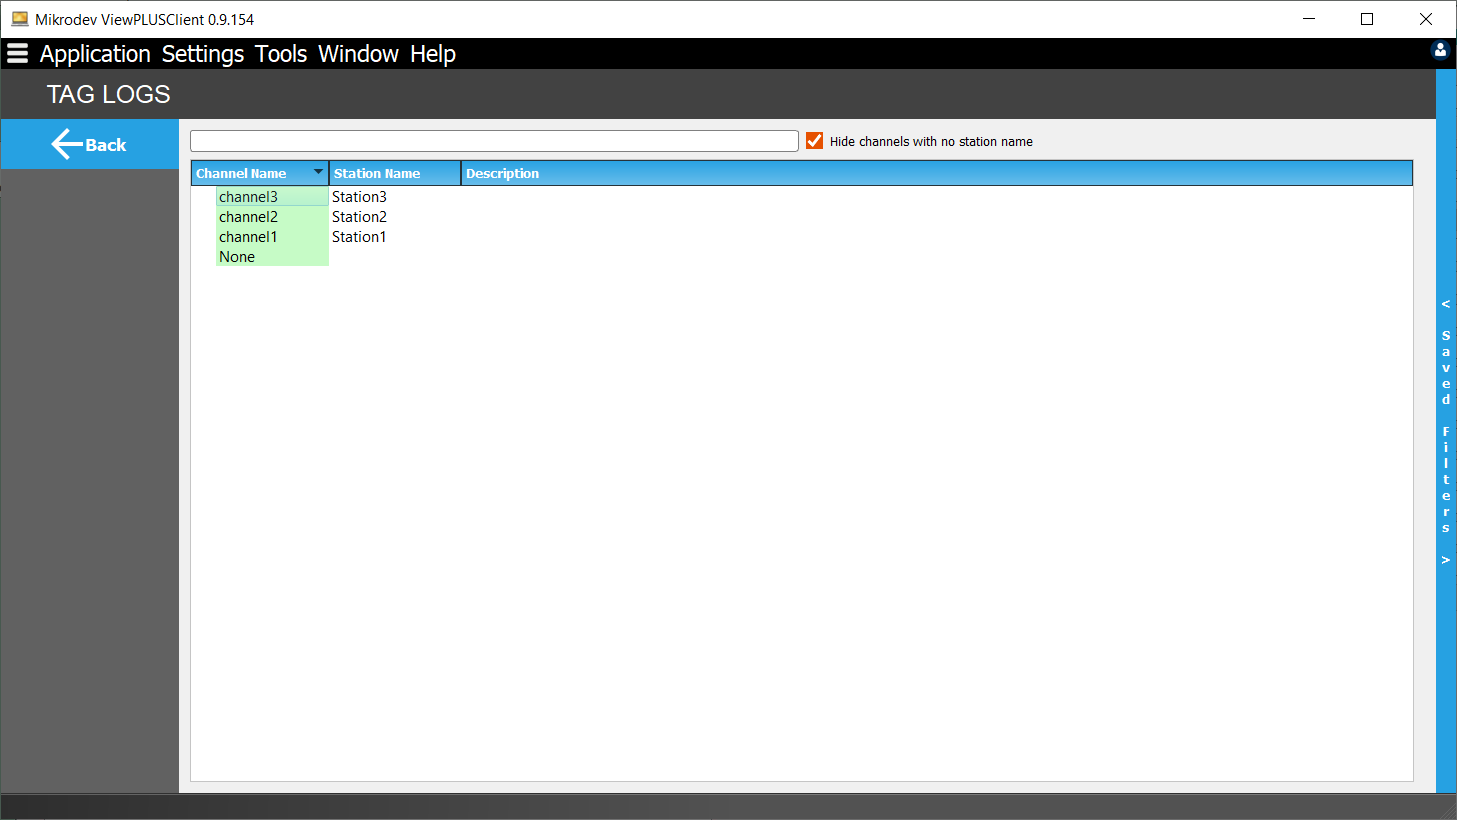
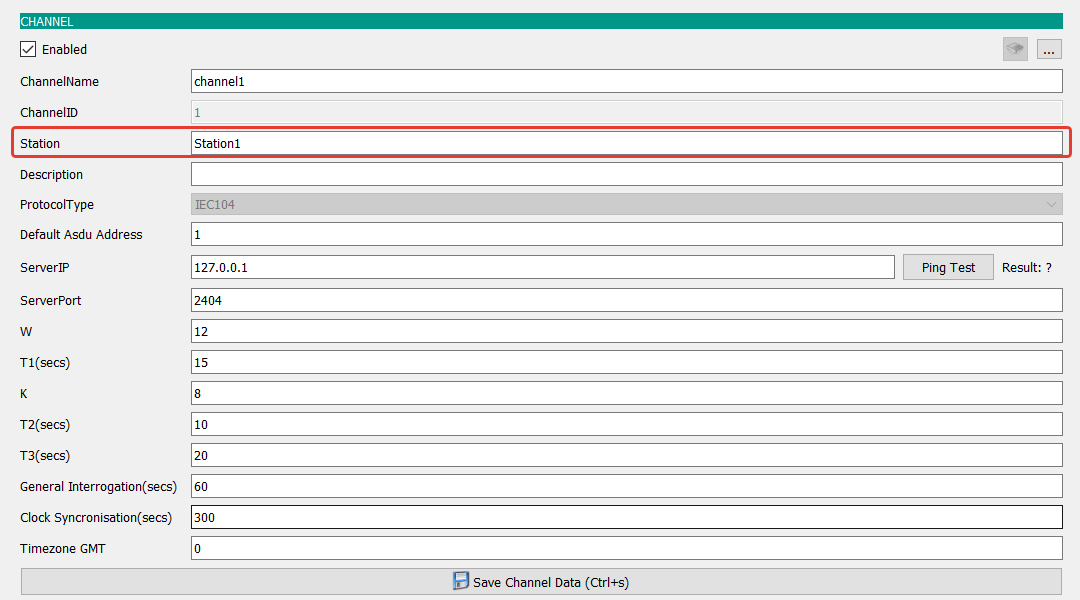
Note: Here, the term "station" refers to the section where the channels are defined in the ViewPLUS Tag Channel Editor page. When you click on the station name, the tags under that station will be listed.
To make a selection from all tags, you choose the "All Tags" option.
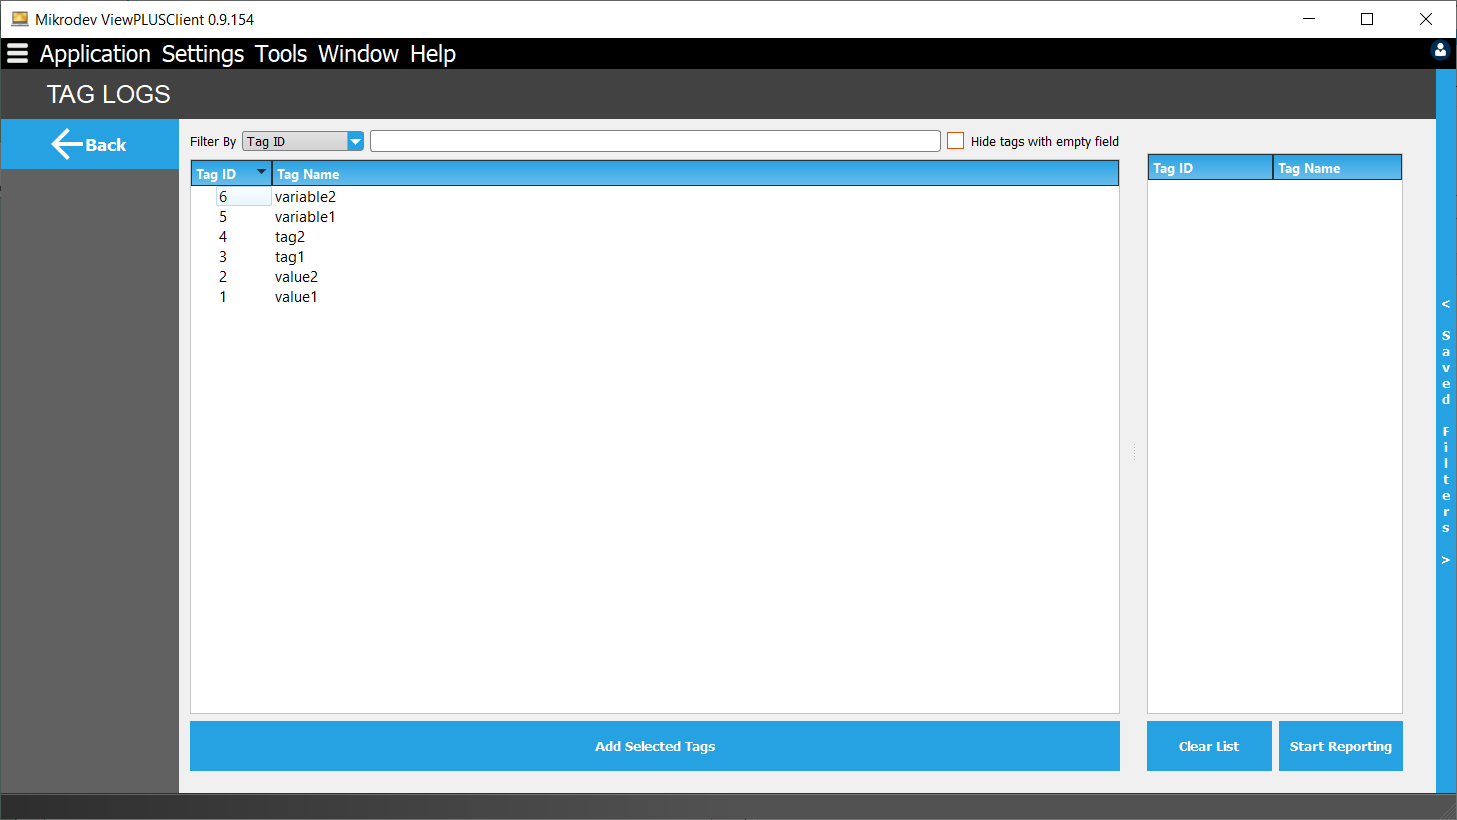
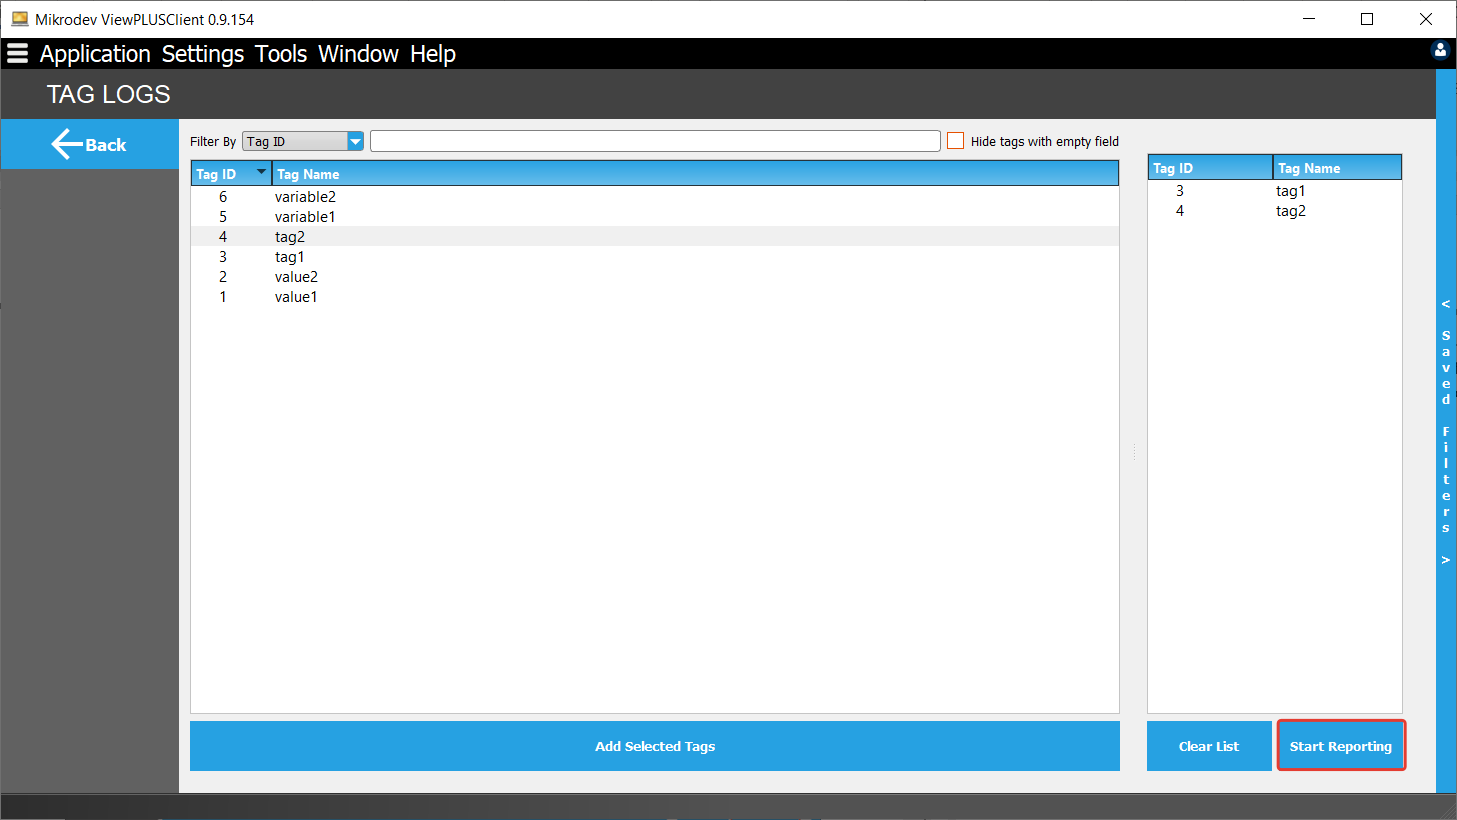
Based on tag properties, filters can be applied to the tag list in various ways. Tags to be included in the report can be selected by double-clicking them in the left panel. The selected tags will be displayed in the right panel. To open the reporting screen for the selected tags, click on the "Start Reporting" option located at the bottom right.
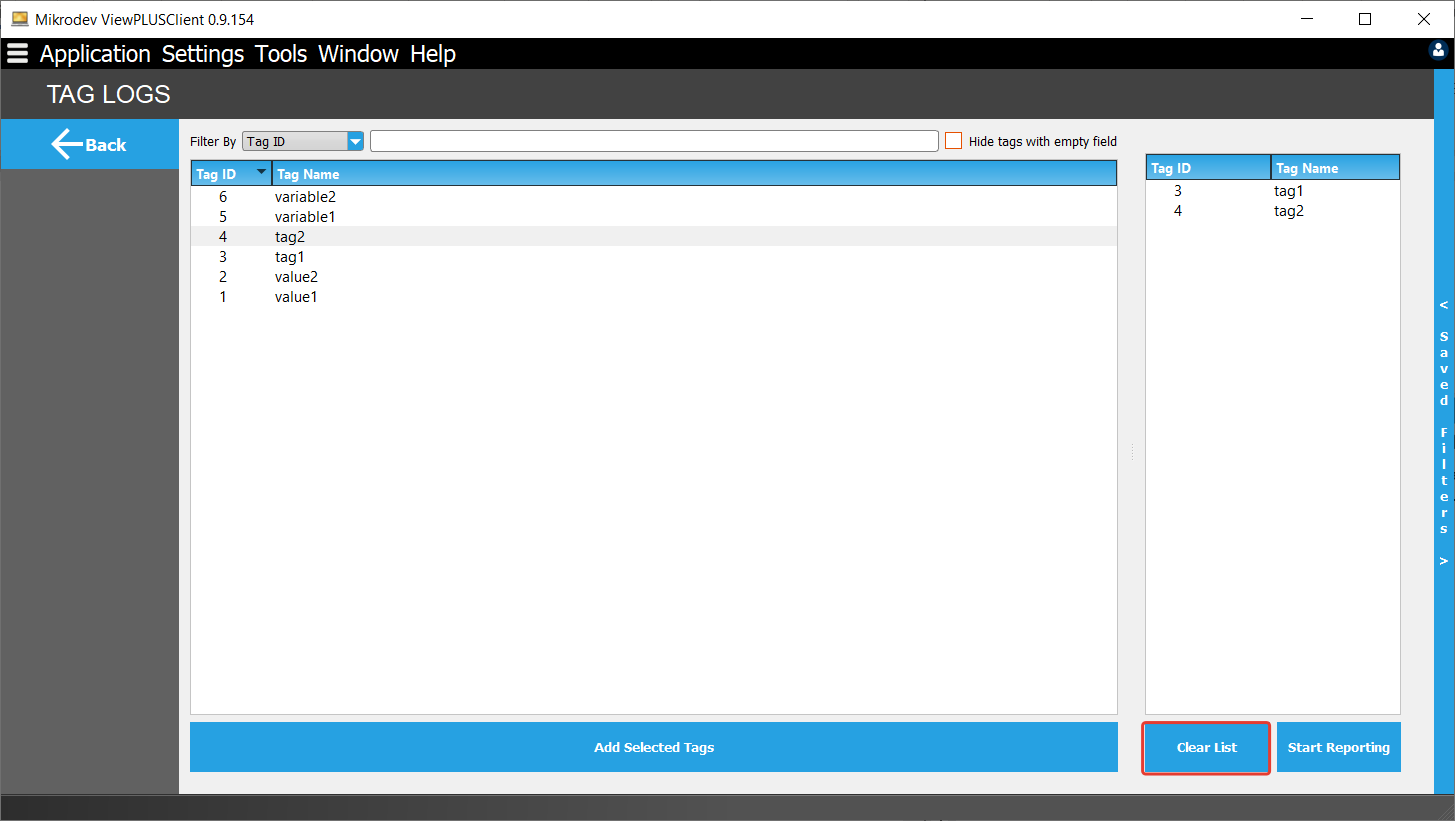
To delete a specific tag from the right panel, select the tag and press the "Delete" key on the keyboard. To delete all tags at once, choose the "Clear List" option.
To View Tag Logs in the Reporter Screen
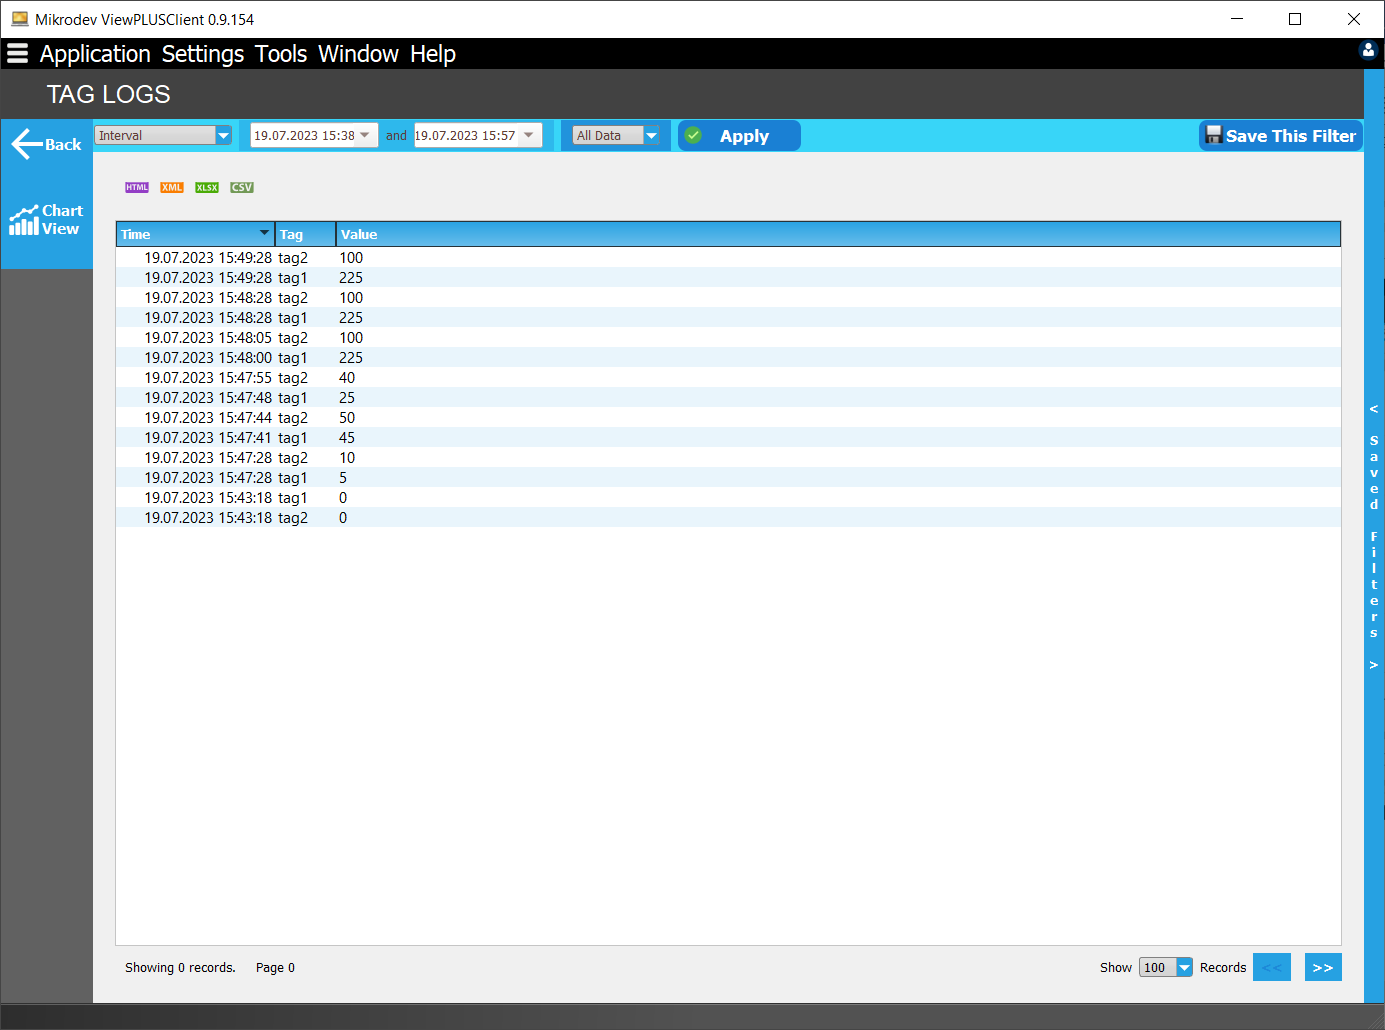
When the report page is first opened, the values of the selected tags are displayed graphically for a specific time range. To view the data in a tabular form, you can select the "Table View." You can make different selections related to the time range and type of data displayed.

Selecting a Time Interval
The displayed data's time interval can be selected in 4 different ways:
In the Range: Two different dates are selected to specify a specific date range for displaying data.
Last N: You can select hours, days, weeks, etc., to calculate the time backward from the current date/time. For example, selecting "Last 1 Hour" will display data for the past hour.
Date/Time: You choose a specific date and time for data display.
Time Ago: To view historical reports from the displayed date, you can select minutes, hours, days, etc. For example, selecting "Today - 5 days" means 5 days ago. If "Today - 5 Months" is selected, and the time unit is "Months," the time range will be within the same month as that specific date.
After selecting the appropriate filtering option, click on the "Apply" button located on the right side to generate the report with that filter.
Data Type Selection
The data type to be displayed can either be the raw data itself or the statistical value of the data based on the selected statistical feature.
All Data: Shows the actual values of the data recorded in the log.
Statistical: Displays statistical values for the selected time periods, such as average, total, maximum, minimum, variation, and median values of the data. For example, if you select hourly maxima within a daily time range, the time range will be divided into hourly segments, and the maximum values of the data within each hourly segment will be displayed, resulting in an output of 24 data points.
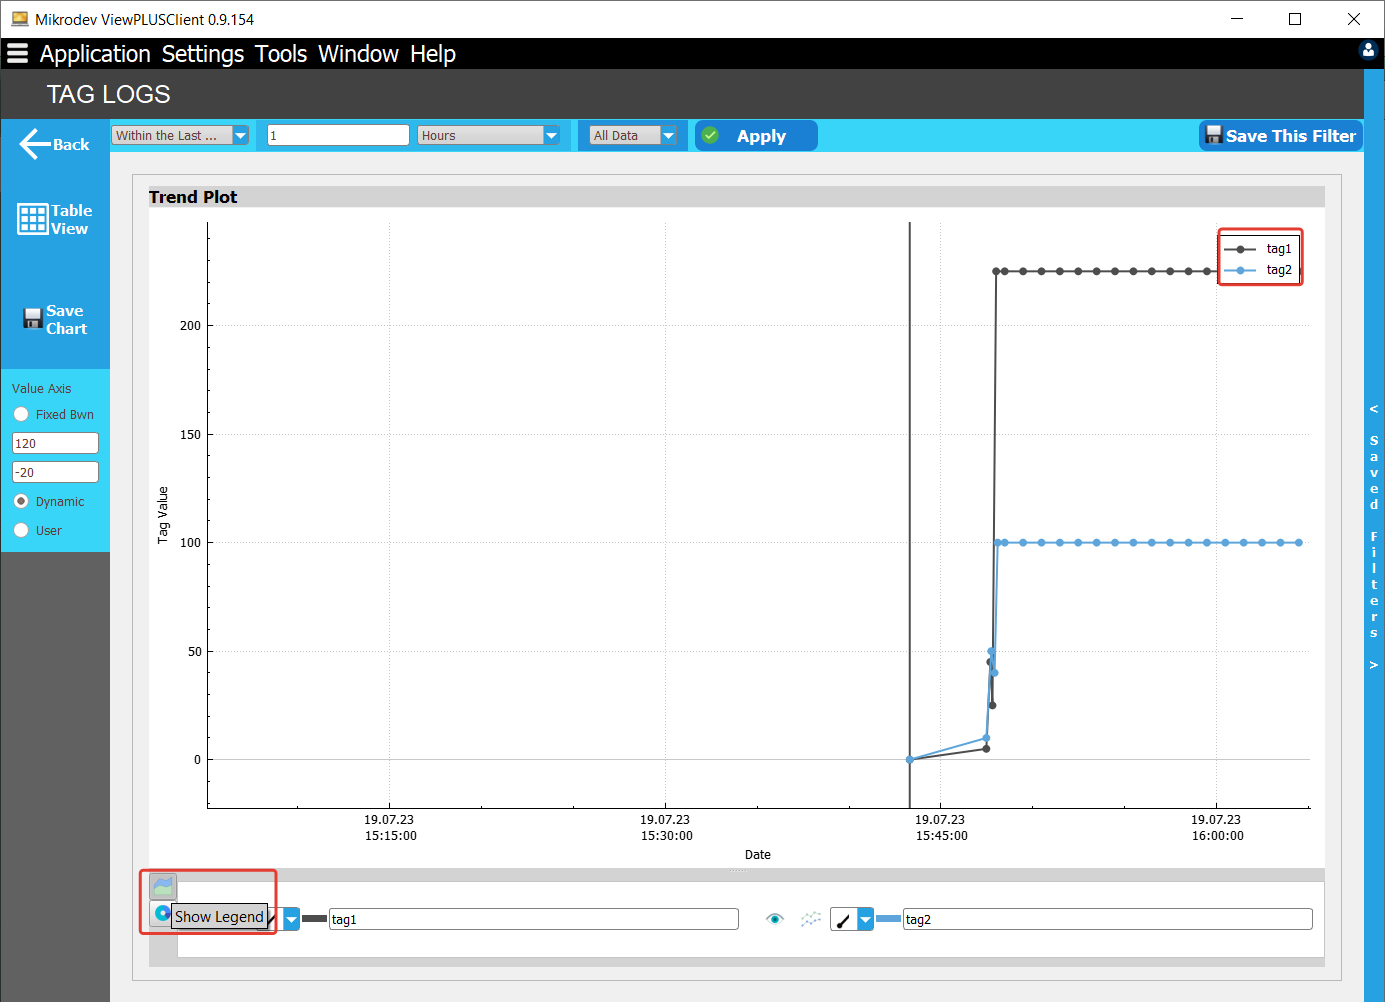
Managing Charts
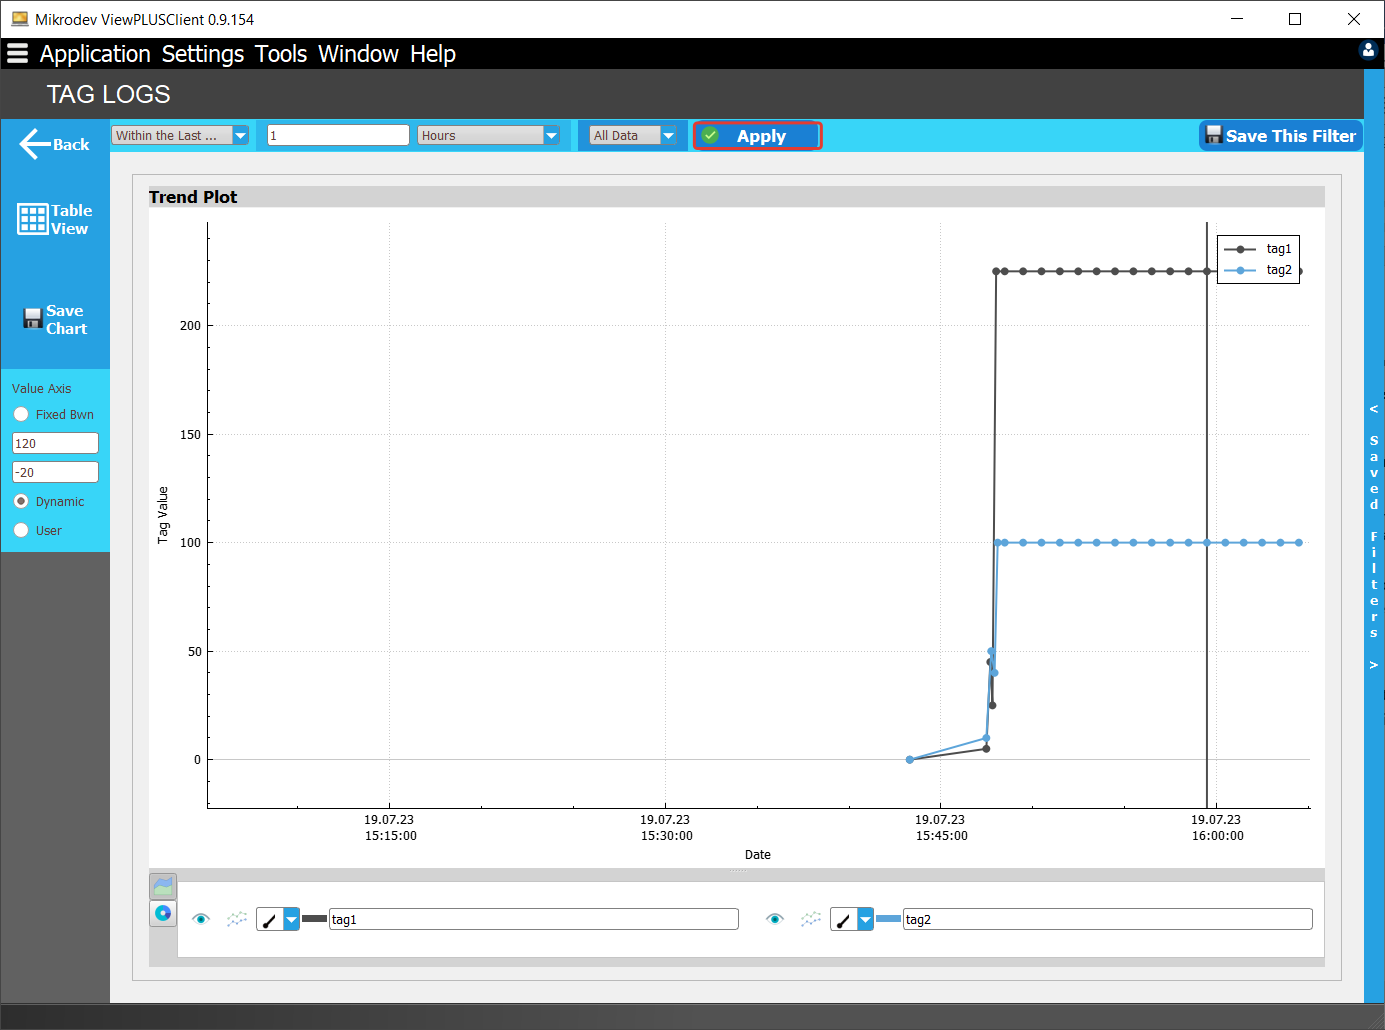
Show Legend: It displays or hides the names of the drawn tags and their corresponding legends, which represent the line colors on the chart, in the top right corner of the graph.
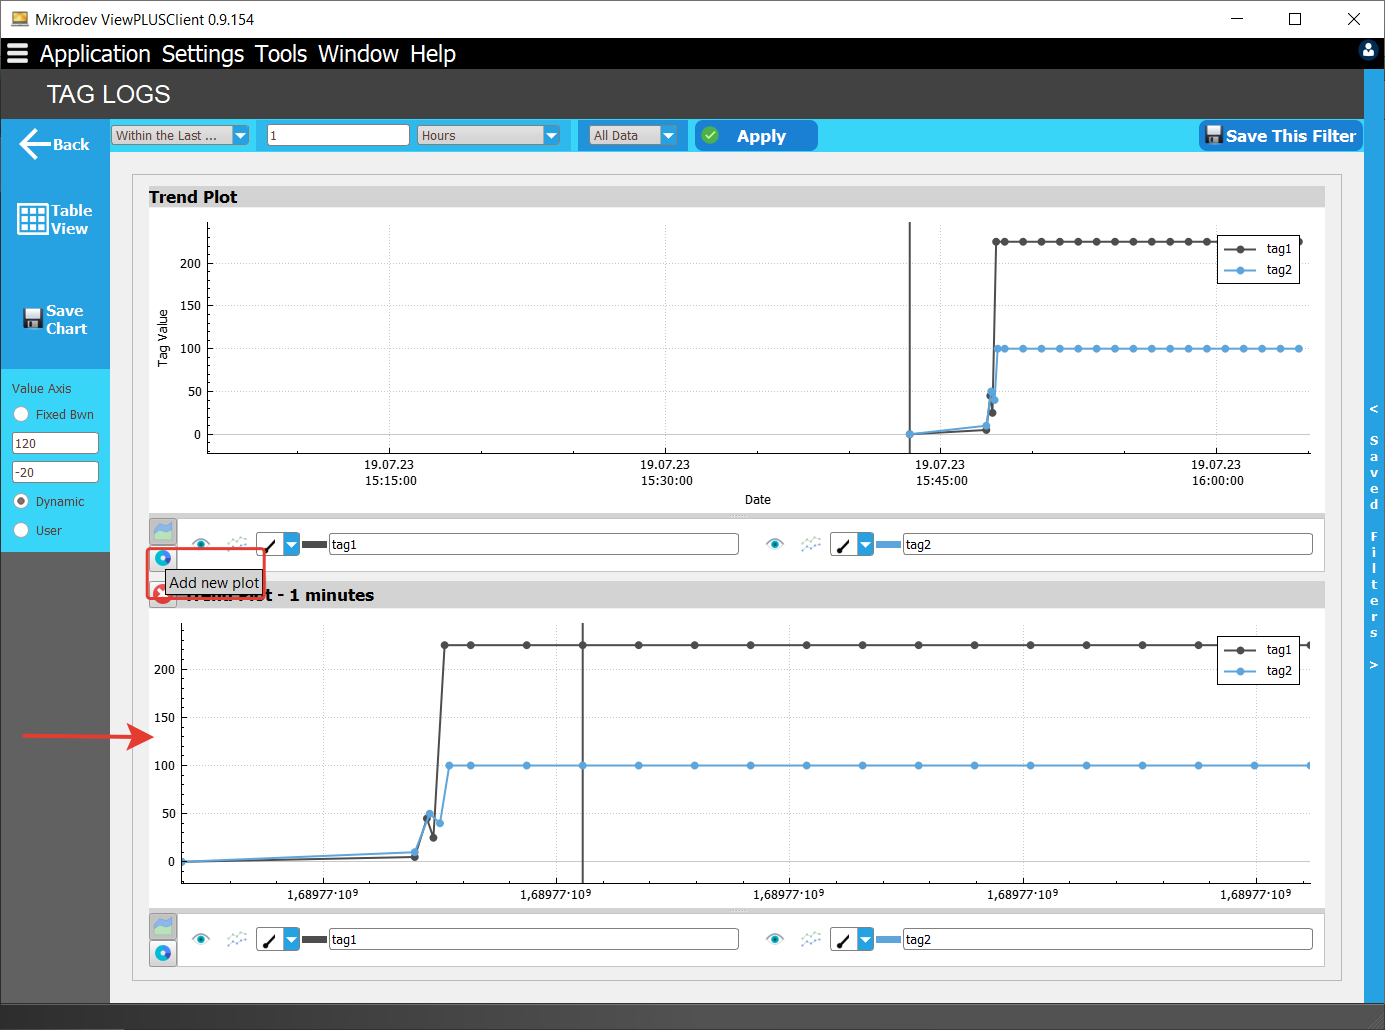
Add New Trend: It adds a new chart object to the main graph, allowing you to compare the data in the main chart with previous periods. The added chart will be displayed in sync with the main chart based on the specified time interval.
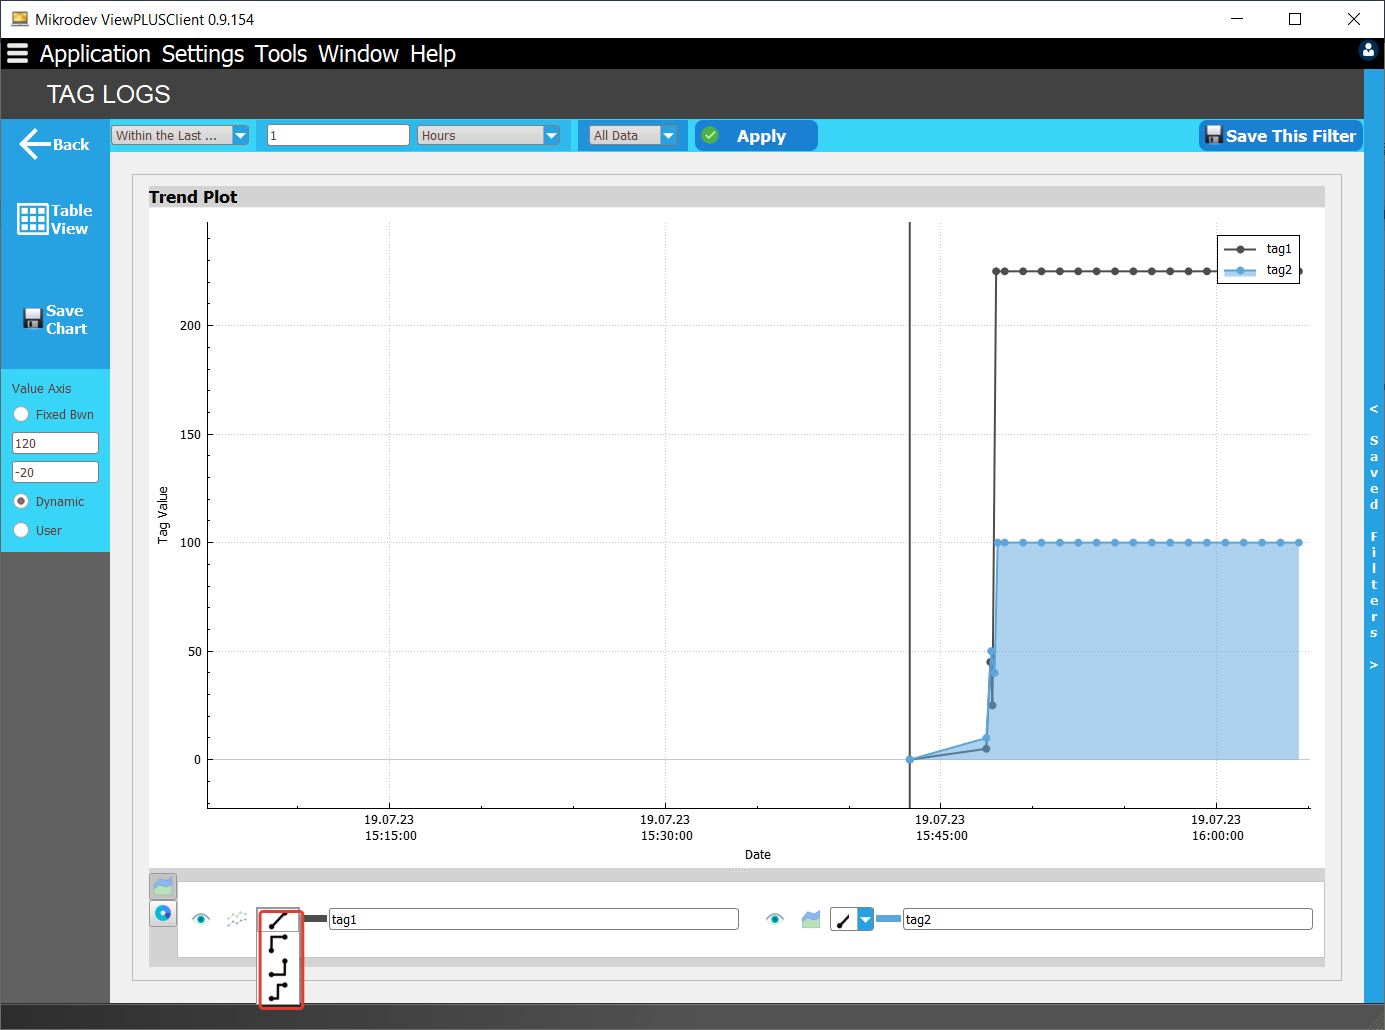
If there is data for the selected item in the range defined in the chart, this data is indicated by a dot. The points shown can be connected to each other in different ways. Below the chart is the chart properties menu for each chart. The following operations can be performed via this menu.
- Show/Hide: This line can be hidden and shown with this button.

- Fill/Clear: The line below the label is filled with integral. That way it might be easier to compare with other tags.

- Joining Points: Points showing label data can be joined in different ways.
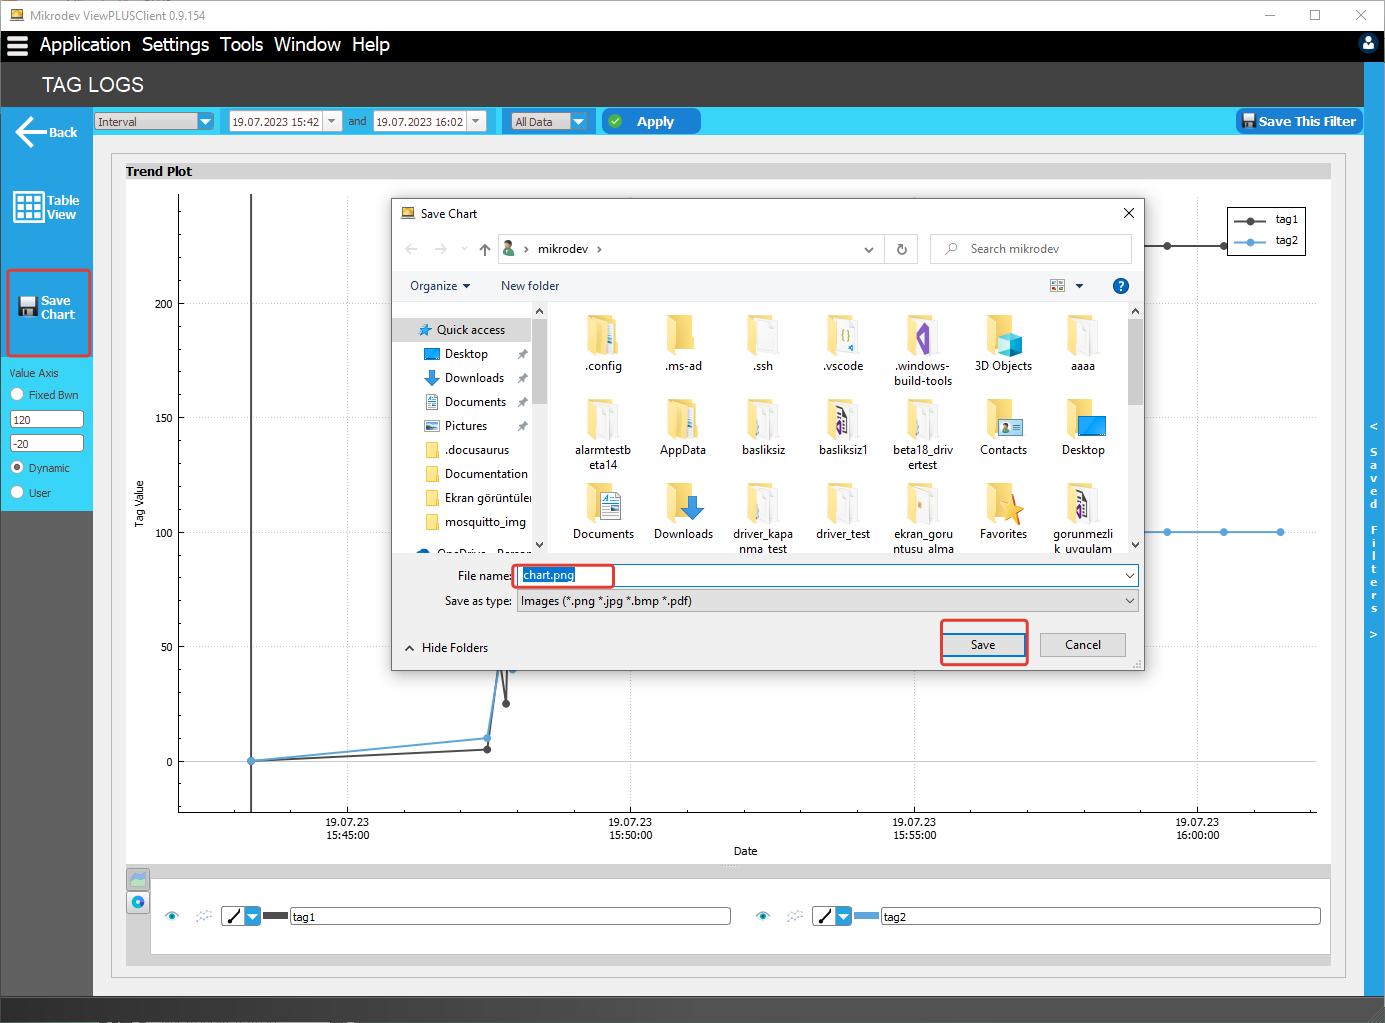
Saving the Charts
According to the selected parameters, the graphic can be saved in an image file in "png" format. Click the "Save Chart" tab on the left panel to save the chart.
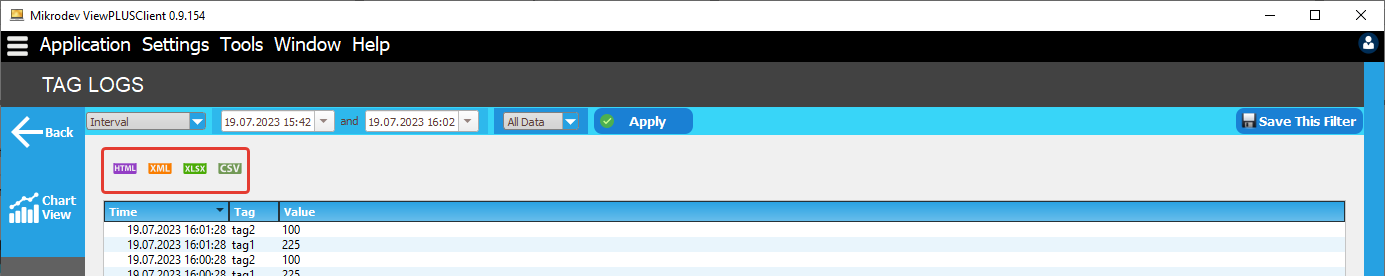
Exporting Data
The data can be exported in various formats based on selected parameters. First, by clicking on the "table view" button, a data table is created. At the top of the table view screen, the buttons "html, xml, xlsx, csv" can be used to convert and store the data in these formats.
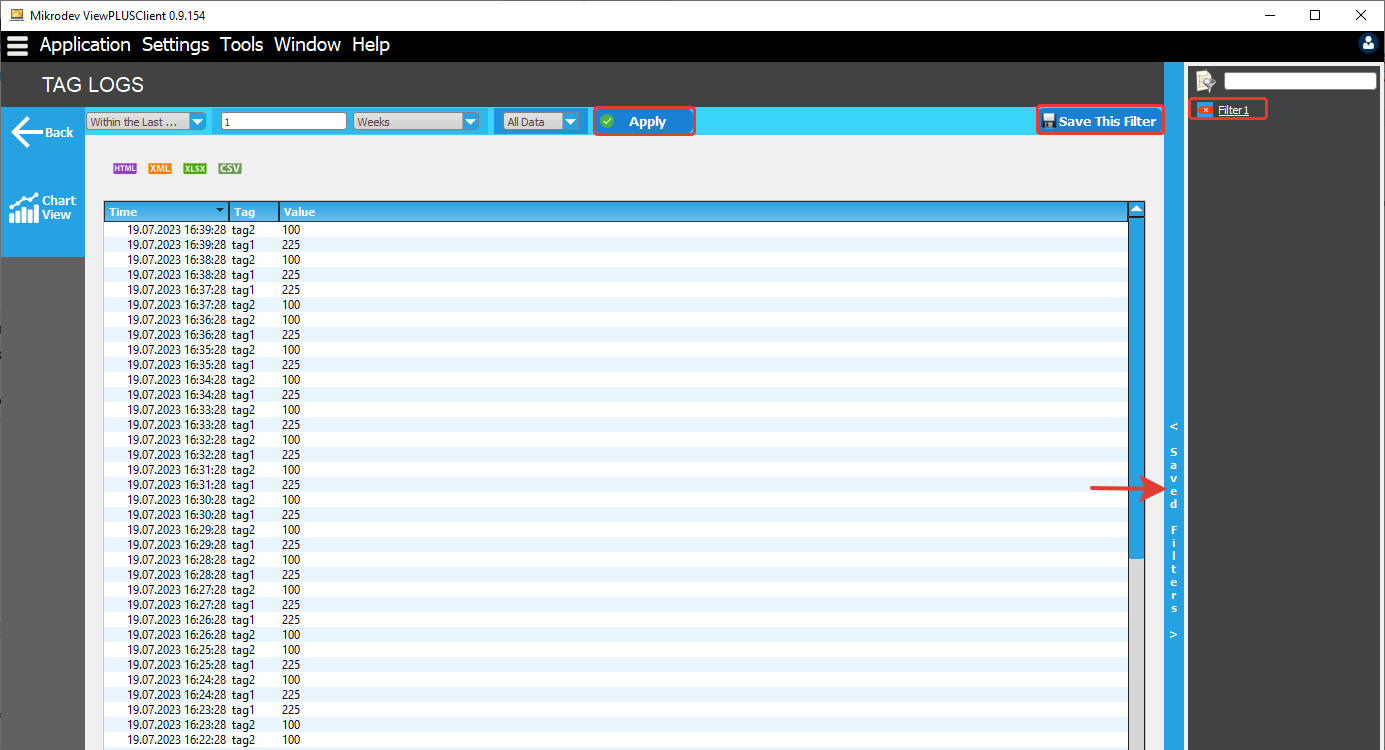
Saving Filters
Selected parameters used to generate data can be saved, and the same filter can be applied whenever needed. To do this, the created parameters must be applied at least once (Apply Button). After doing so, select the 'Save this filter' option, and provide a name for the filter. Filters are saved for the user account. The saved filter will appear in the registered filters menu on the right side of the screen.
Calling Saved Filter Queries
When filters in this menu are right-clicked, their content is copied to the clipboard. This copied content can be linked to objects in the SCADA Editor screen. When the relevant object is clicked, the report screen opens, and the predefined filter is executed.
Creating a Reporting Command
By calling the created filters through the reporting command line, it is possible to generate reports in the desired format. To do this, you need to provide the necessary command parameters for the reporting application. With this feature, automatic reports can be generated at specific time intervals using the Windows operating system's “Task Scheduler”.
Using this feature, it is possible to create automatic reports at specific time intervals using the Windows operating system's "Task Scheduler."
-database The name of the project (Database is the same as the project name.)
-user Database username
-password Database user password
-server Database IP address
-port Database connection port
(-tnsname TNS name for Oracle databases)
-format Report output format. The possible values fort his parameter are HTML, CSV, XLSX and XML.
-query The name of the saved filter. In the reporting application is a crucial parameter required for the reporting command. If this parameter is not provided, the report will not be generated, and instead, the reporting application interface will be opened.
-output Output file path and name
An example command line:
"C:\Program Files\ViewPLUS\bin\ScadaReporter.exe" -database report -user postgres -password mdv -server localhost -port 5432 -query Filter1 -format csv -output "C:\Users\mikrodev\Desktop\Reports\taglog"
Creating a Shortcut to the Reporter Application
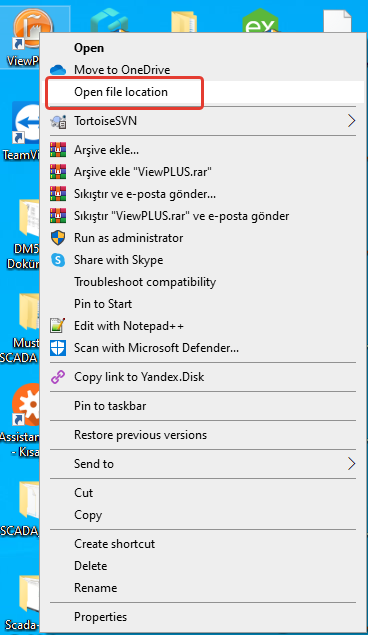
Point to ViewPLUS Scada application and click open file location option.
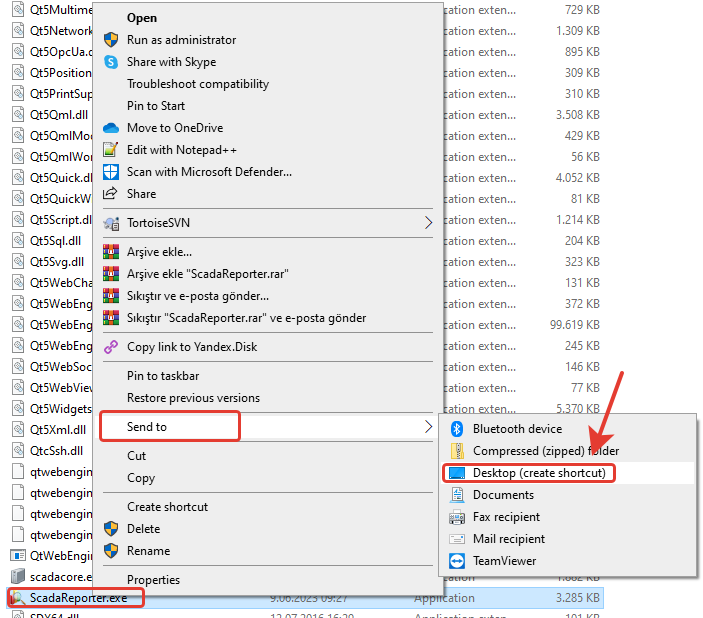
ScadaReporter.exe file is found in this file and right click and select Send -> Desktop (create shortcut) option.
The reporter shortcut application created on the desktop is hovered, right-clicked and the properties window opens.
The command line created in heading 1.1.8 is entered in the target section here.
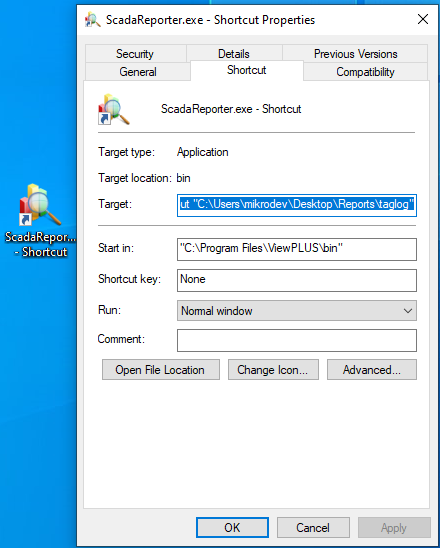
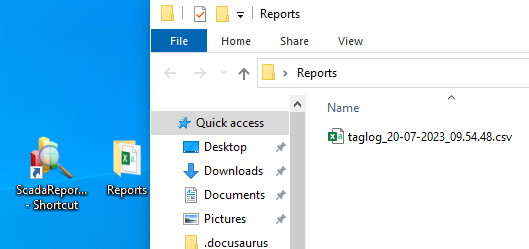
When the shortcut is clicked, an output will be created as a csv file named taglog with the data of the filter we saved as Filter1.
Automatically Generate Output from Reporter
By using this feature described in Title 1.1.8, it is possible to generate automatic reports at certain time intervals via the "Task Scheduler" of the Windows operating system.
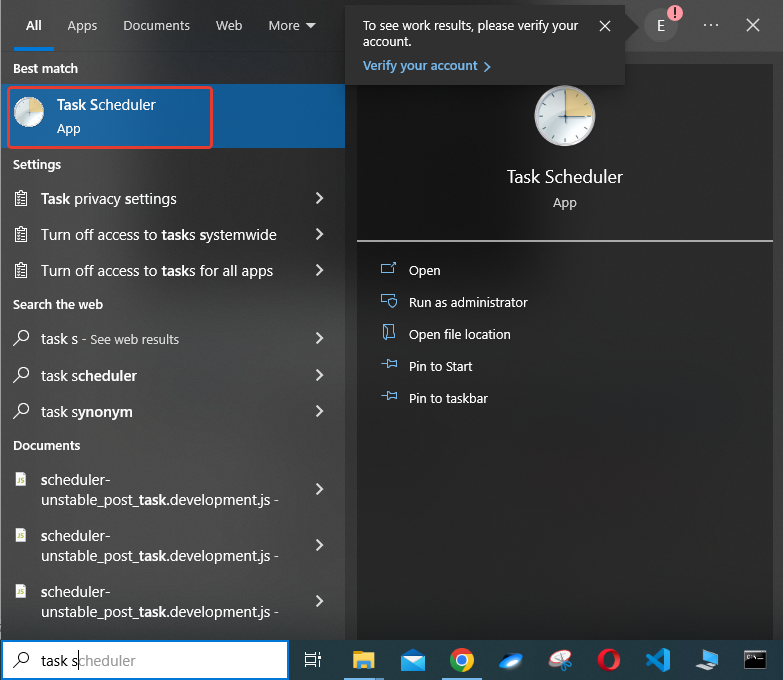
Start -> Task Scheduler application opens.
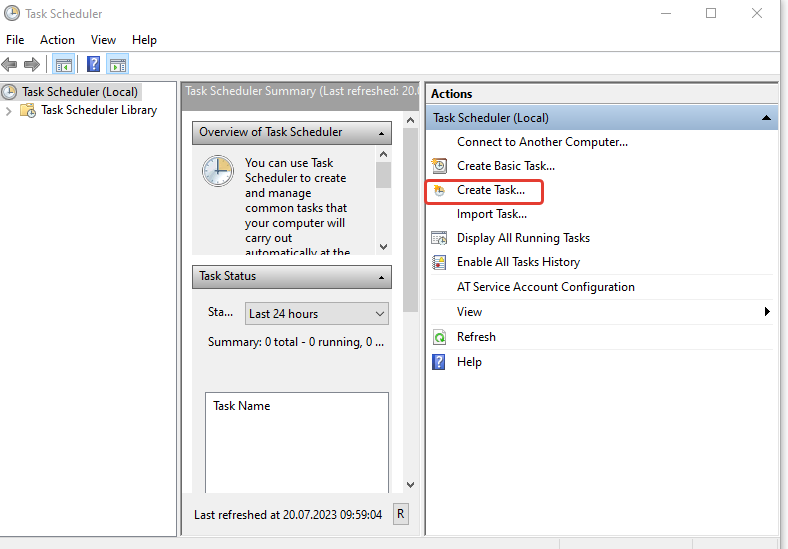
Click on Create task.
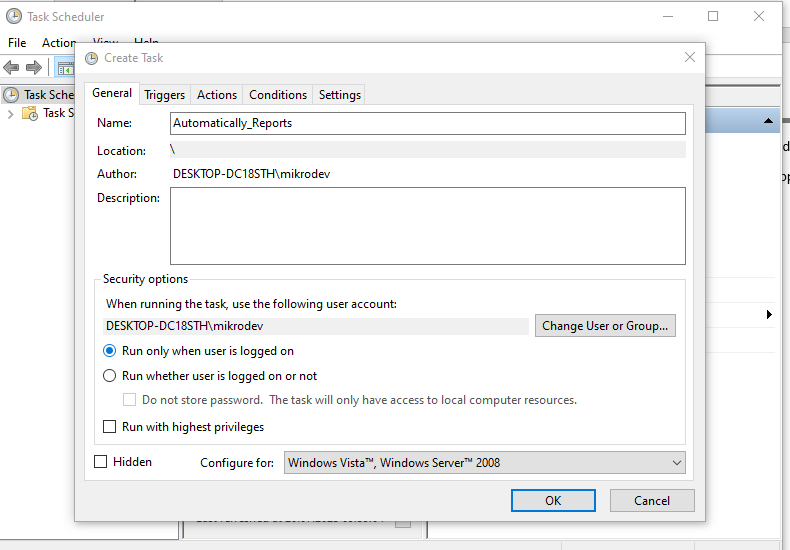
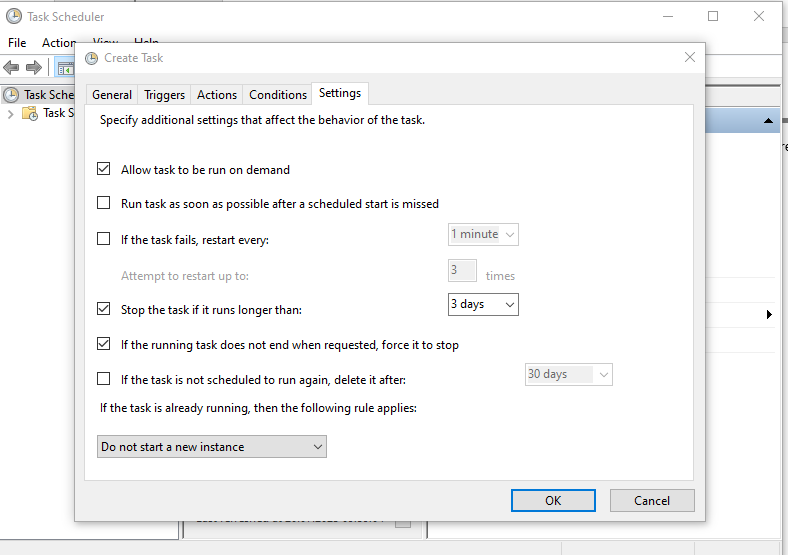
If the report is to be created, these settings are entered in the Create Task window.
In the general part; The name of the created task, its description and security options are included.
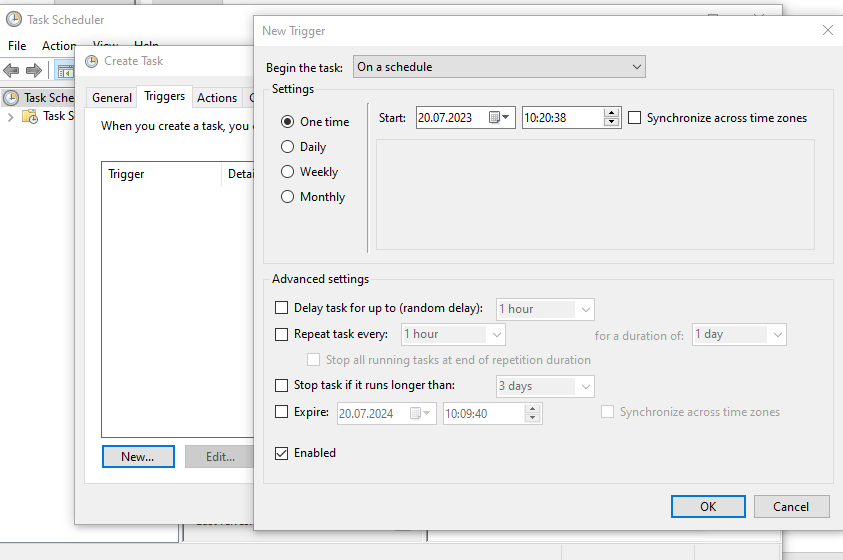
The time to generate the report output is selected from the Triggers section.
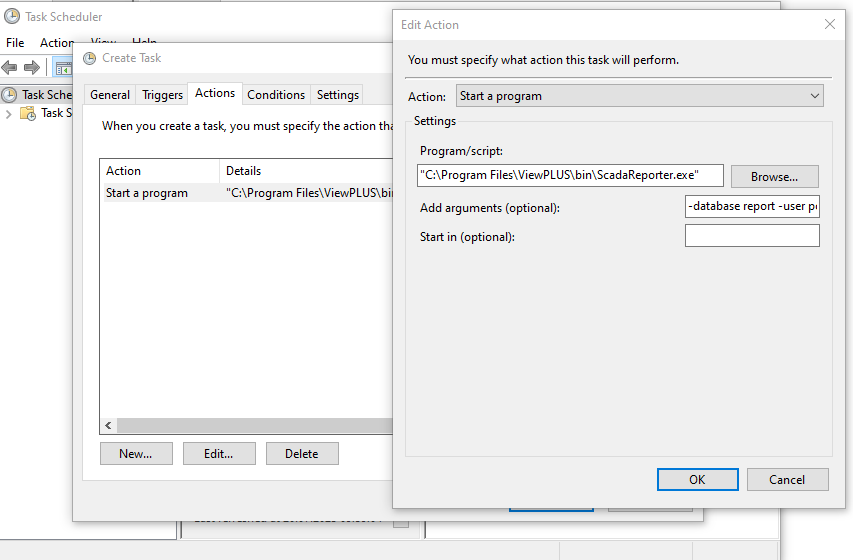
In the Actions section, the reporter command line that you want to run should be entered as follows.
Program/script: "C:\Program Files\ViewPLUS\bin\ScadaReporter.exe"
Add arguments (optional): -database report -user postgres -password mdv -server localhost -port 5432 -query Filter1 -format csv -output "C:\Users\mikrodev\Desktop\Reports\taglog"
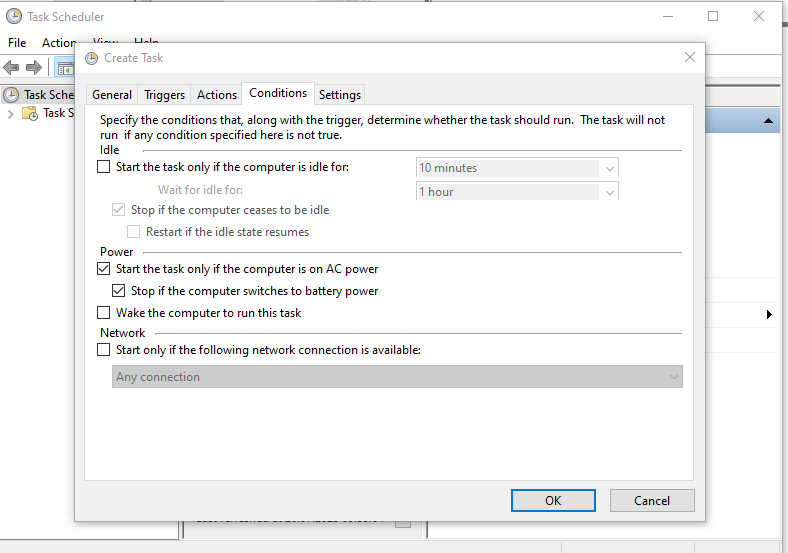
From the terms section; The conditions for starting the task are selected.
In the Settings section, additional settings related to the created task are entered.
Alarm Logs
Occurring alarms can be followed from the Alarm Logs section of the Reporter screen.
Selection of Alarms to Display on the Reported Screen
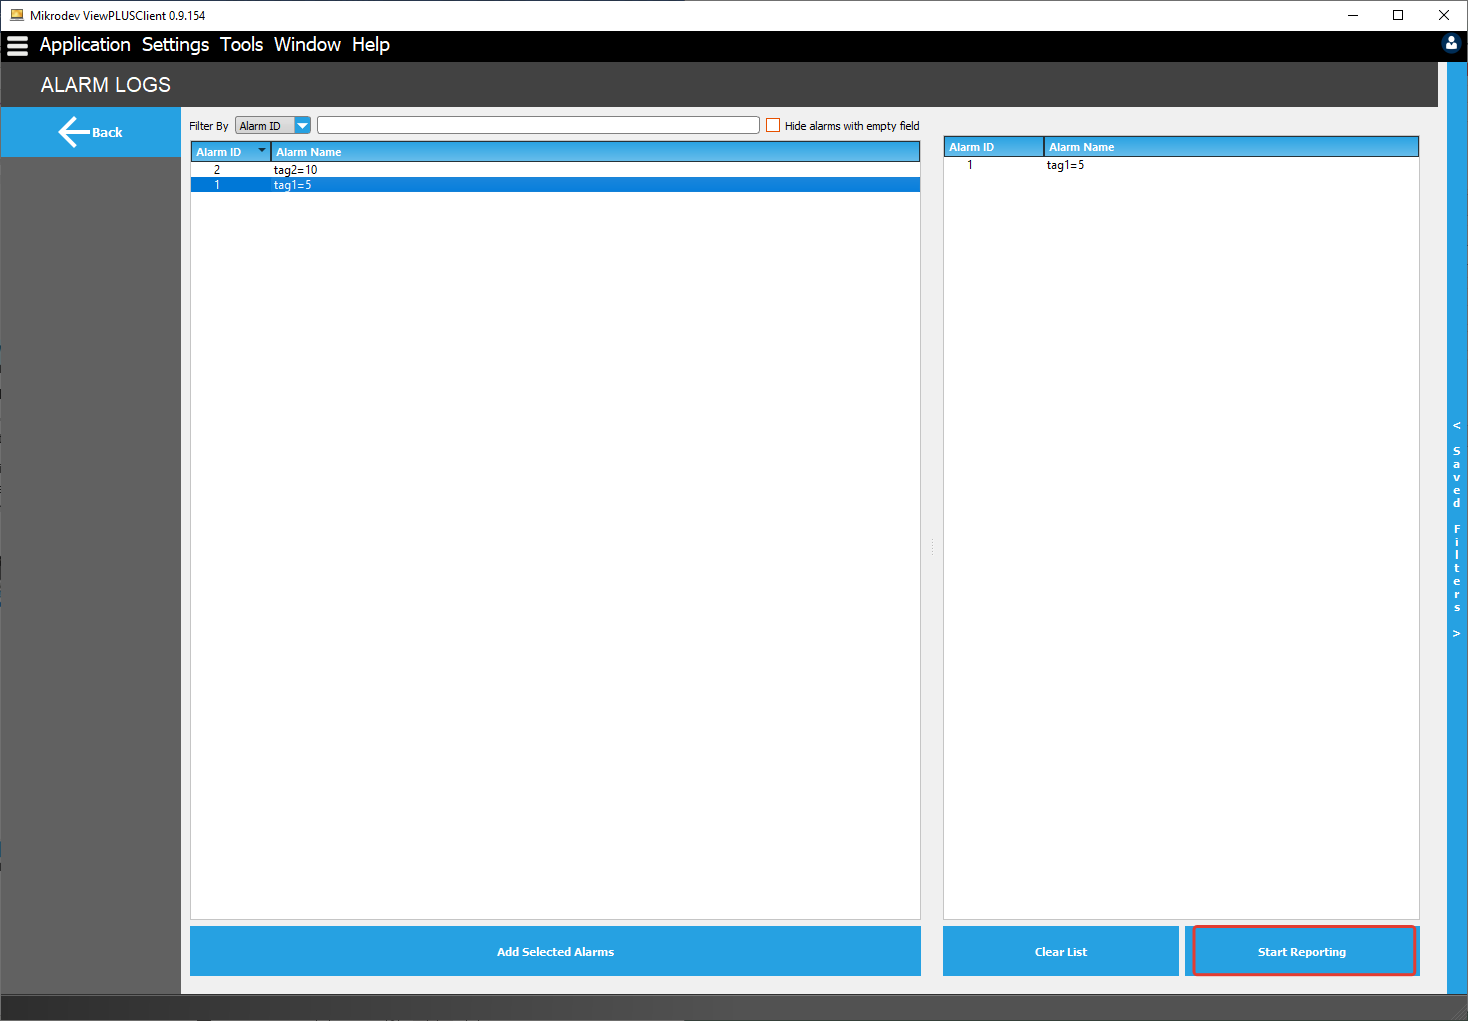
The alarms created using the ViewPLUS SCADA Editor are displayed on the alarm selection page.
Alarm filtering can be done in various ways based on alarm properties. To select alarms for reporting, you can double-click on them in the list on the left panel. The selected alarms will then be displayed on the right panel. To open the reporting screen for the selected alarms, click on the "Start Reporting" option located at the bottom right corner.
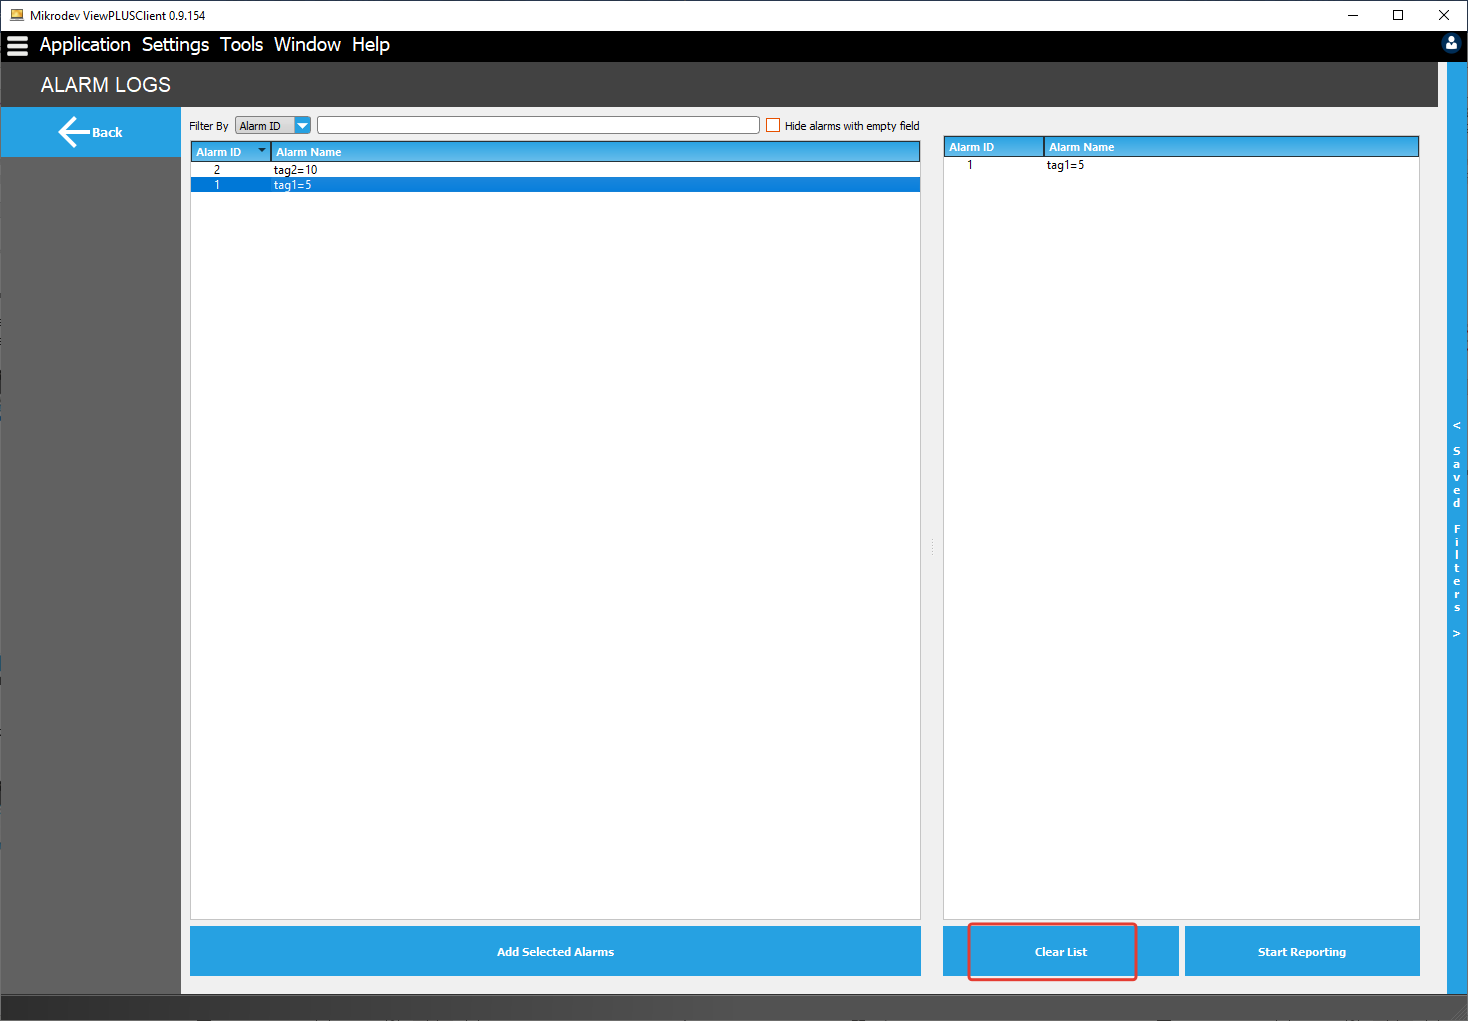
To delete a specific label from the right panel, select the label you want to delete and press the "Delete" key on your keyboard. If you wish to delete all labels, choose "Clear List" or "Clear All" option.
Viewing Alarm Logs on the Reporter Screen
When the report page is first opened, the values of the selected alarms are displayed as a table for a certain time period.
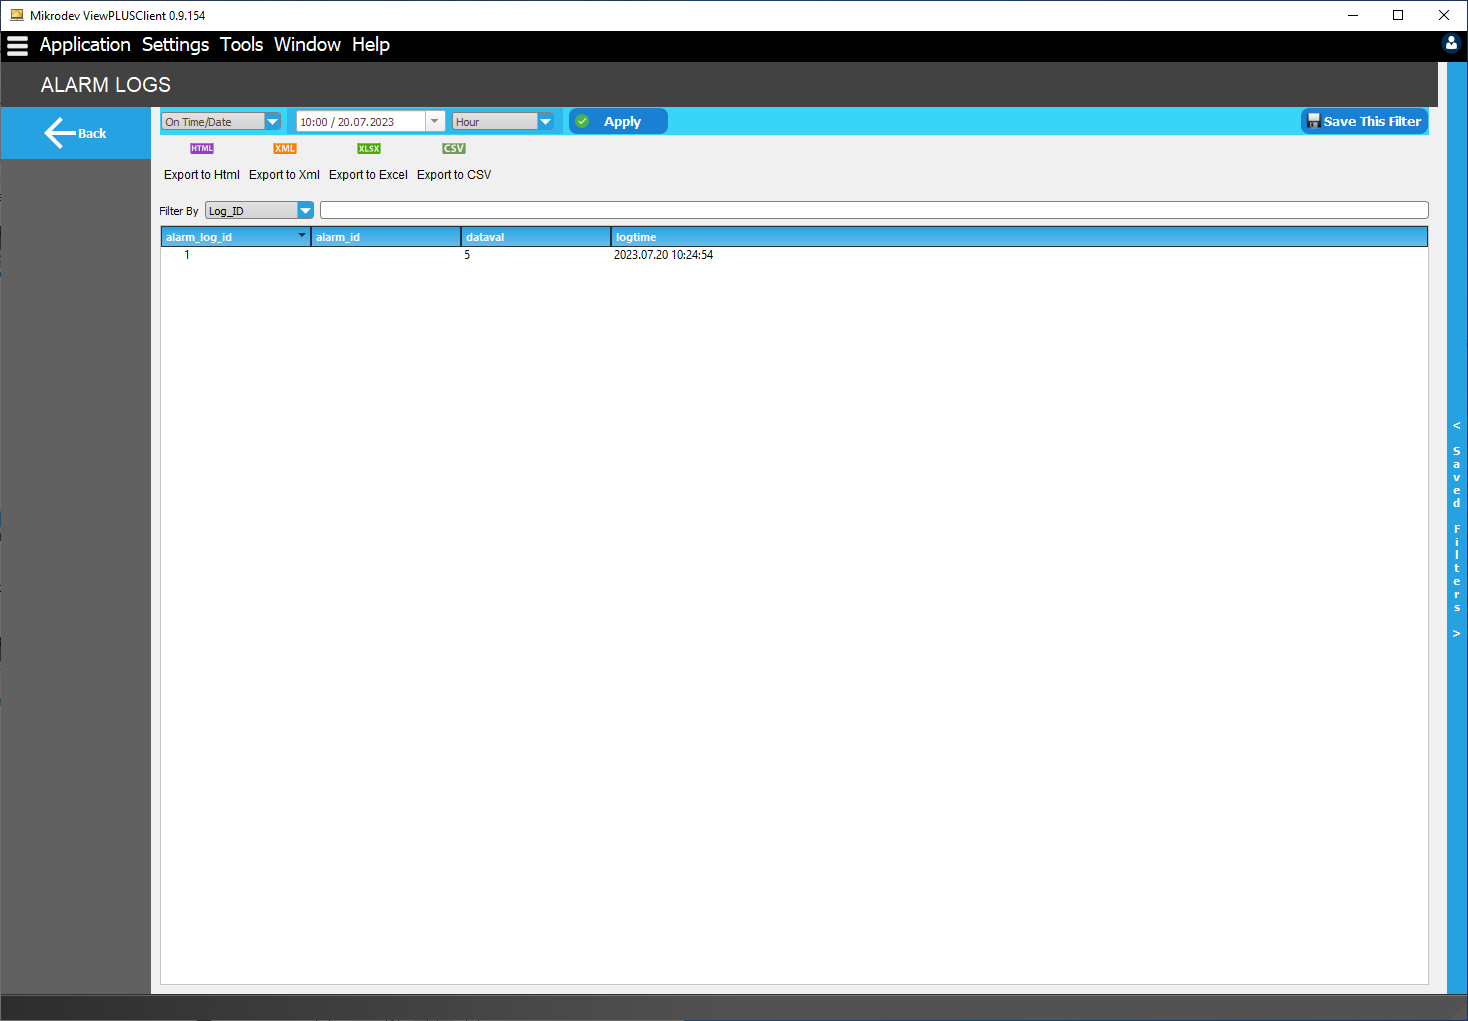
Choosing a Time Range
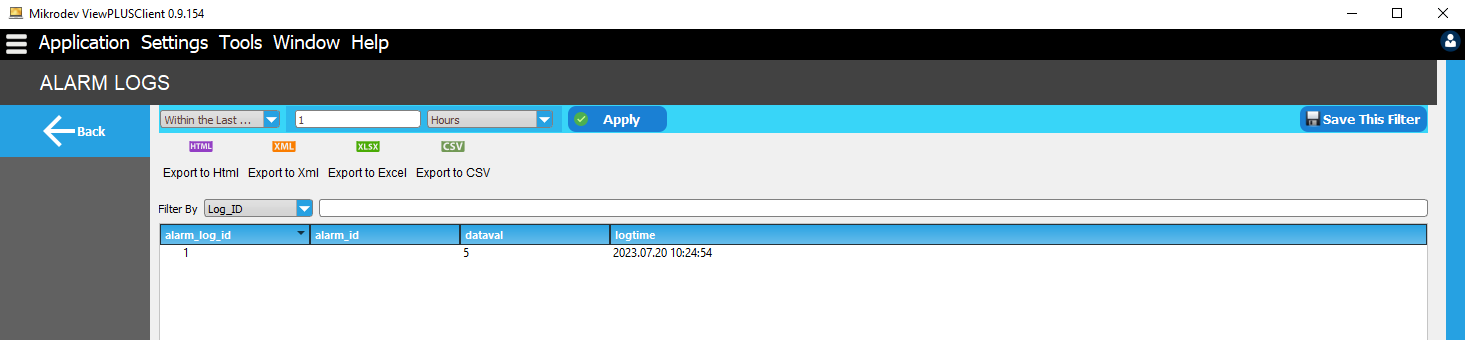
The time interval of the displayed data can be selected in 4 different ways.
Interval: 2 different dates are selected.
Within the last in: Hour, day, week, etc. is selected and the time is calculated backwards from the current date/time.
On Time/Date : A definite date is selected.
Time Ago: Select minutes, hours, days, etc. to view a retrospective report from the day it was viewed. is selected. For example, "Today - 5 days" means "5 days ago". If "Today - 5 Months" is selected and the time unit is "Month"; The month of that date is selected as the time range.
After selecting the appropriate filtering options, click on the apply option on the right to receive a report with that filter.
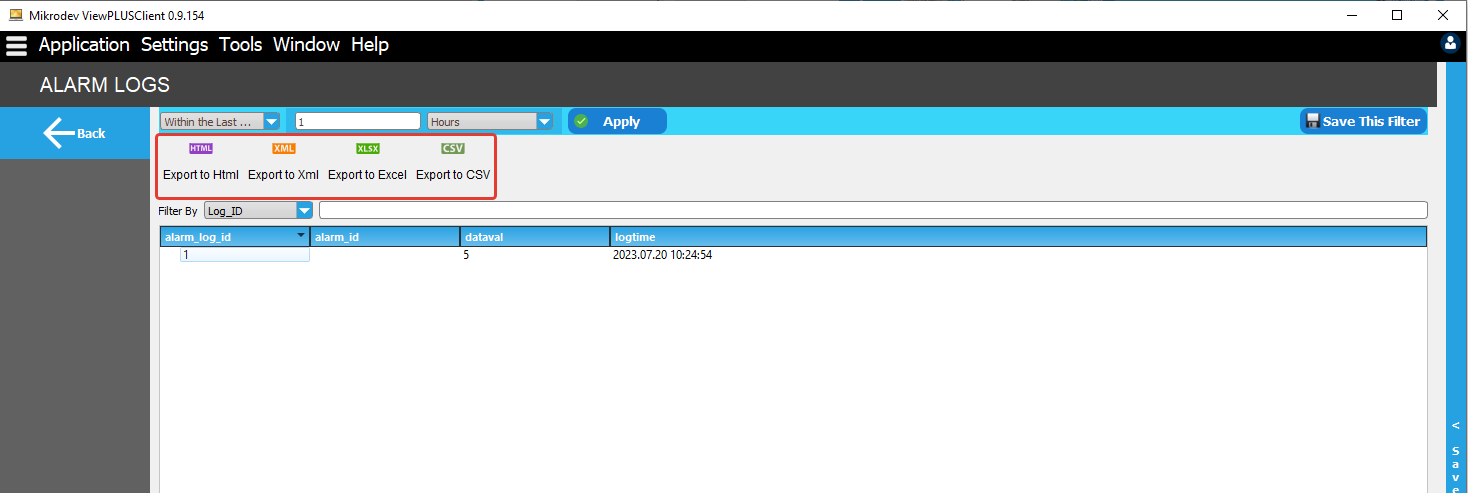
Export Data
Data can be exported in various formats according to the selected parameters. Using the "html, xml, xslx, csv" buttons at the top of the reporting screen, the data in the table is converted to these formats and stored.
Saving Filters
The parameters selected to generate the data can be saved and the same filter applied again as needed. The parameters created for this must be applied at least once (Apply Button). Once you've done that, select "Save this filter" and the filter will be given a name. Filters are saved for the user account. The saved filter is located in the saved filters menu on the right side of the screen.
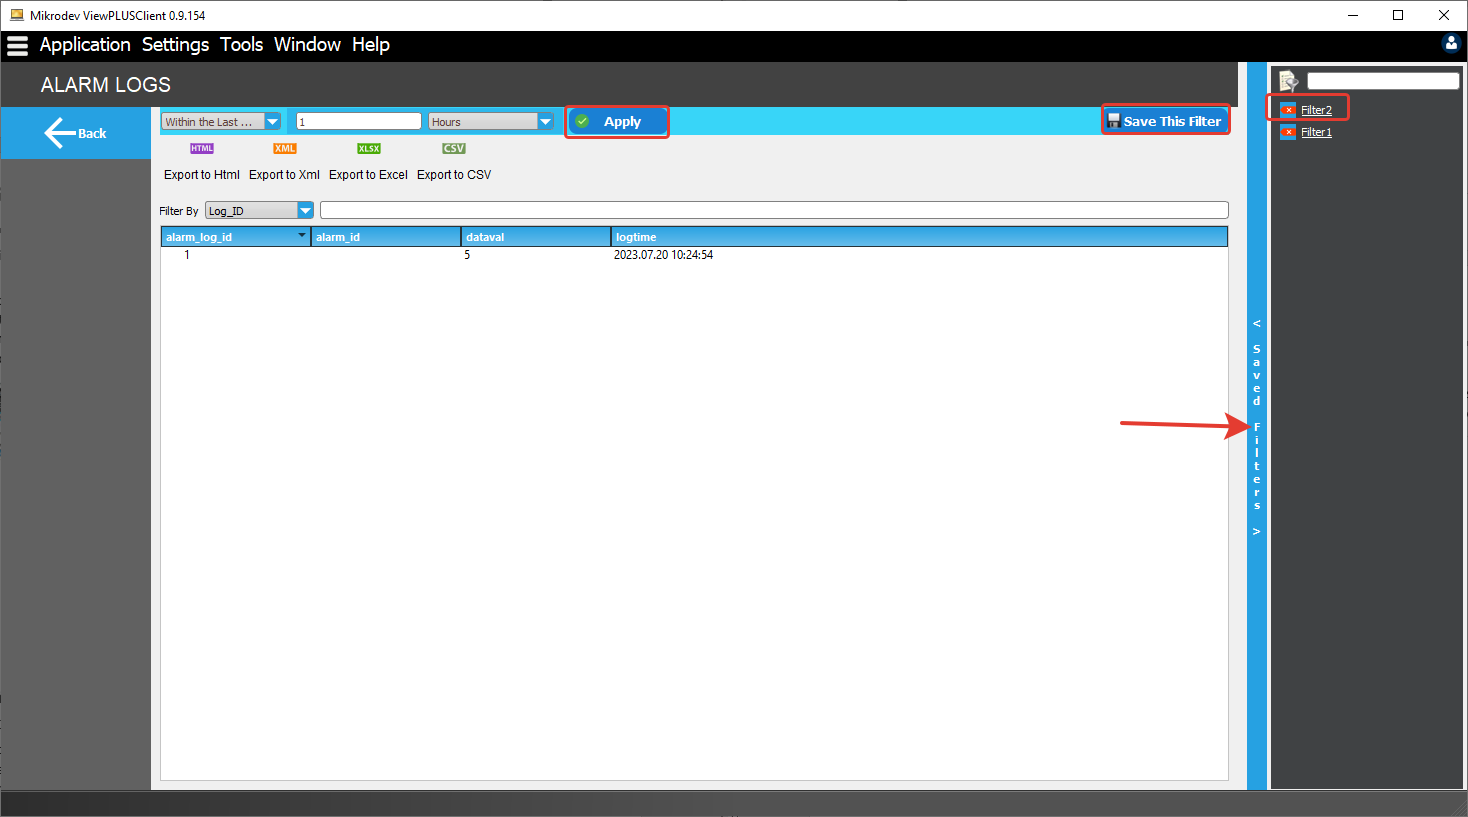
Calling Saved Filters Queries
When the filters in this menu are copied by right-clicking with the mouse, the filter content is copied to the clipboard. This copied content can be linked to objects on the SCADA Editor screen. When the relevant object is clicked on this screen, the report screen opens and the predefined filter is run.
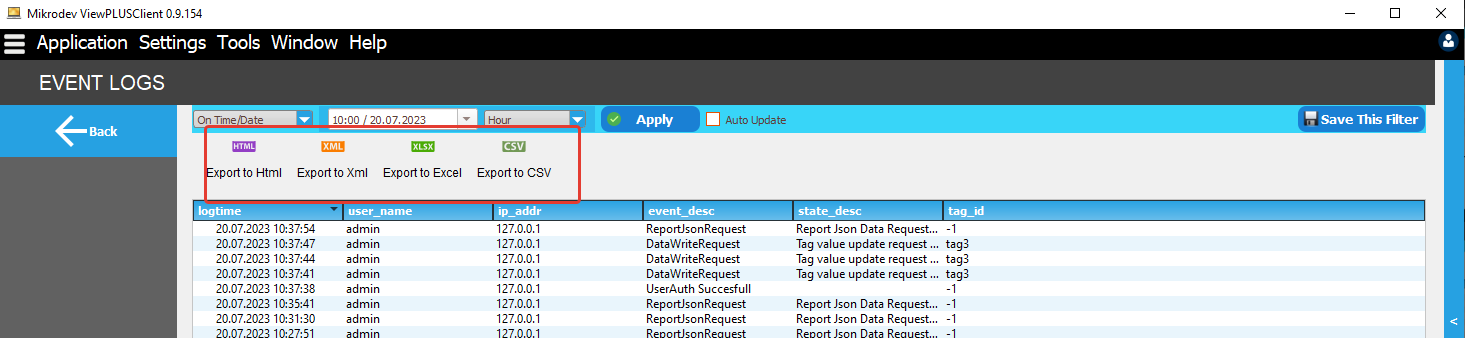
Event Logs
User actions can be followed in the Event Logs section of the Reporter screen.
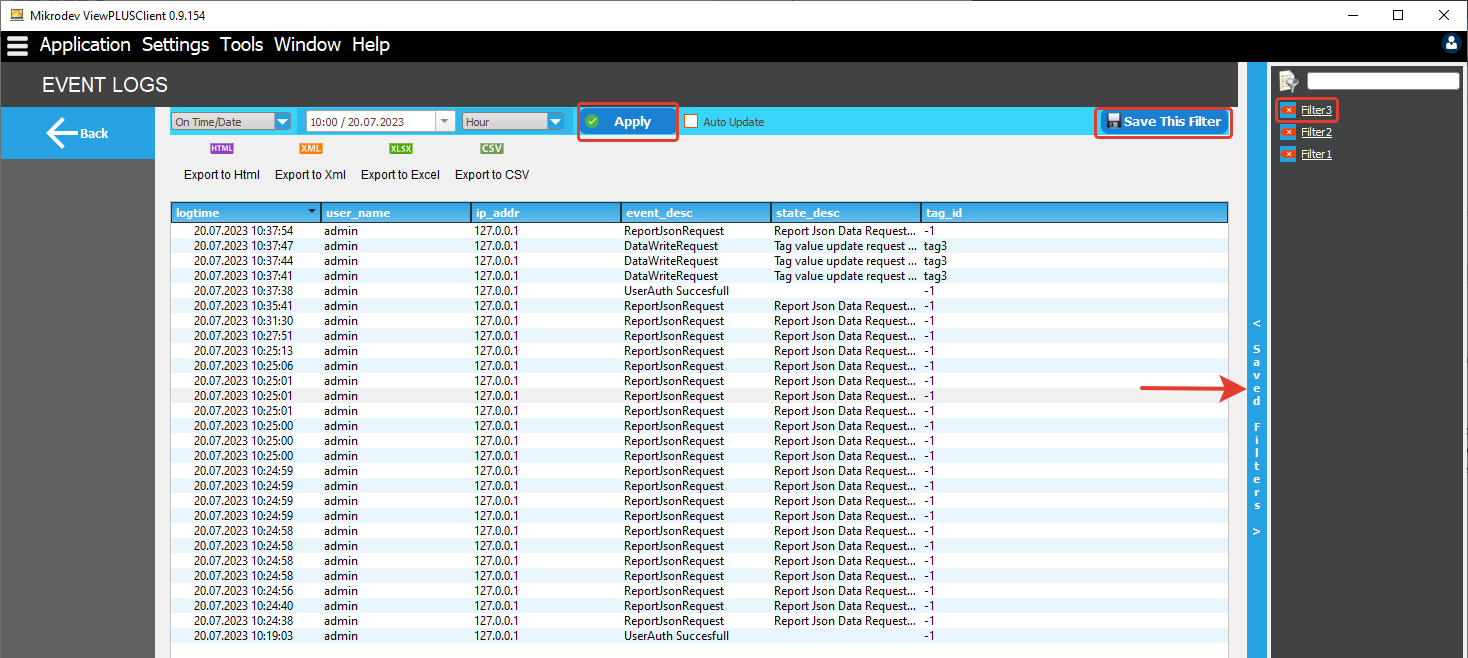
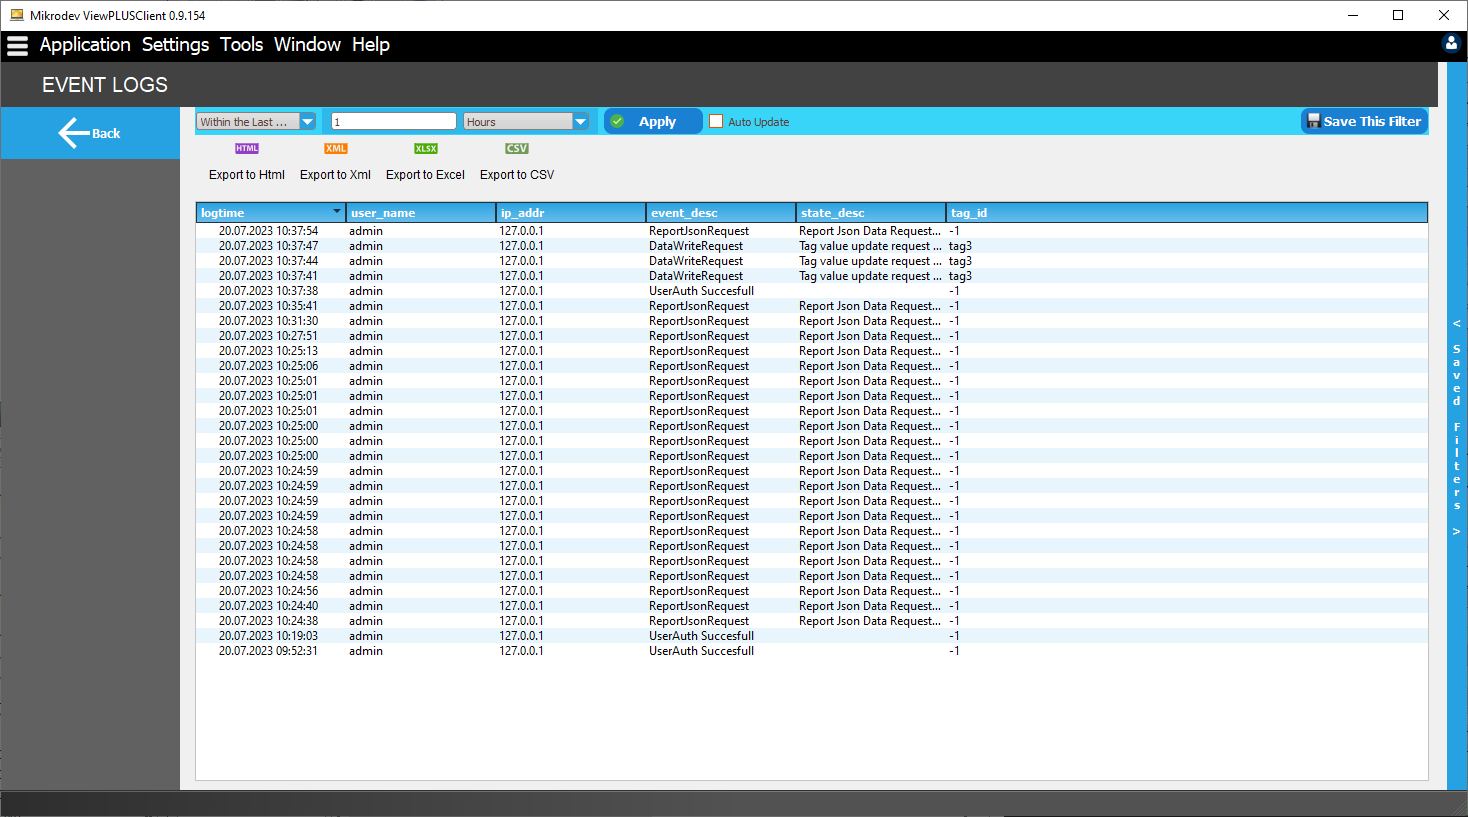
Viewing Event Logs on the Reporter Screen
When the report page is first opened, all user activities are displayed as a table.
IP addresses of users logging into ViewPLUS Client screen; writing values to tags, login requests to reporter pages, etc. knowledge of events; The tag names sent by the users and the event time information of these events can be accessed from the event logs reporter page.
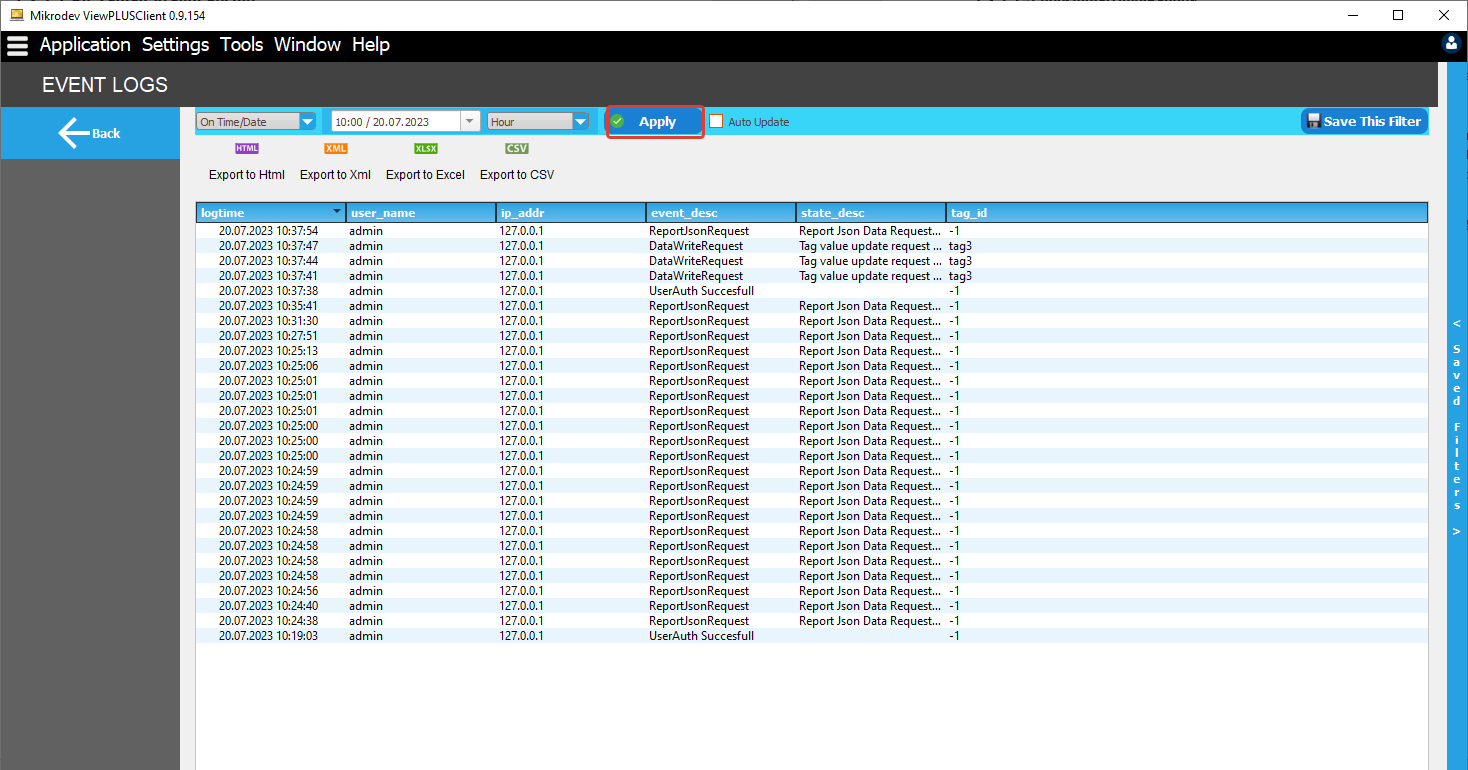
Choosing a Time Range
The time interval of the displayed data can be selected in 4 different ways.
Interval: 2 different dates are selected.
Within the last in: Hour, day, week, etc. is selected and the time is calculated backwards from the current date/time.
On Time/Date : A definite date is selected.
Time Ago: Select minutes, hours, days, etc. to view a retrospective report from the day it was viewed. is selected. For example, "Today - 5 days" means "5 days ago". If "Today - 5 Months" is selected and the time unit is "Month"; The month of that date is selected as the time range.
After selecting the appropriate filtering options, click on the apply option on the right to receive a report with that filter.
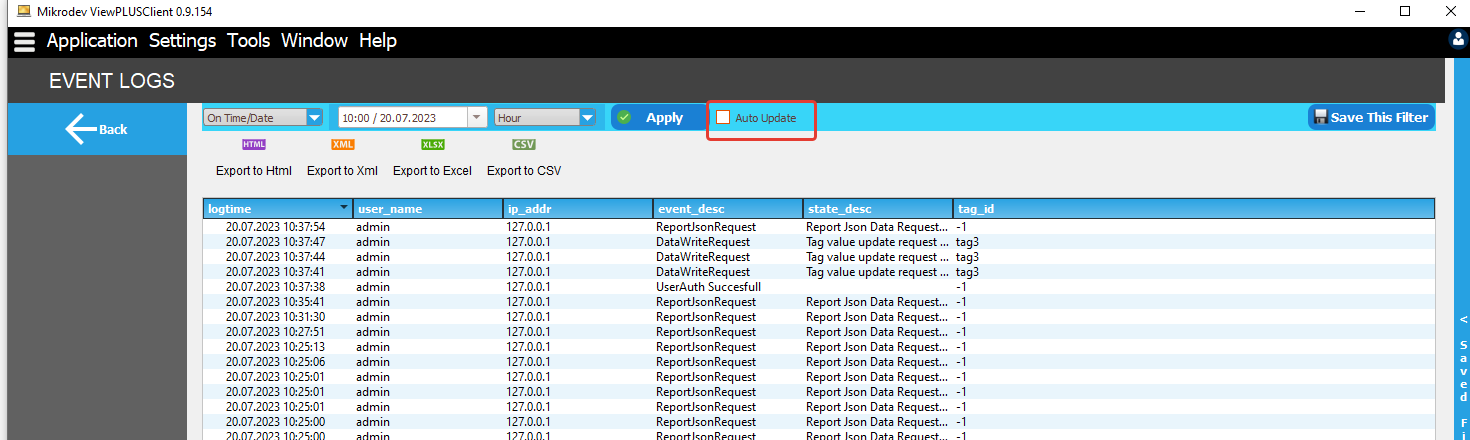
Note: If the Auto Update option on the right side of the application is checked, user actions are automatically updated on the reporter screen.
Export Data
Data can be exported in various formats according to the selected parameters. Using the "html, xml, xslx, csv" buttons at the top of the reporter screen, the data in the table is converted to these formats and stored.
Saving Filters
The parameters selected to generate the data can be saved and the same filter applied again as needed. The parameters created for this must be applied at least once (Apply Button). Once you've done that, select "Save this filter" and the filter will be given a name. Filters are saved for the user account. The saved filter is located in the saved filters menu on the right side of the screen.